|
By: Jeffrey Cohen, Investment Advisor Representative US Advanced Computing Infrastructure, Inc. May 17, 2022 The US Equities markets are set to open GREEN or up this morning. What do we see?
US retail sales data was ok, with month on month (MoM) sales up 1%. I could not tell whether these were real sales, so this could just be inflation at work. Car sales drove the increase, which is not good for general Main Street as these tend to be lumpy purchases. We saw dramatic inflation last night into this morning in food (wholesale food prices) and gasoline and oil are very high right now. Walmart is set to open down 6% to 136.72. Ouch, this is a big fall. It either means that investors want to be in specialty retail (e.g., mall shops) or that the discount shopper is in trouble. China looks to be having continued trouble with COVID, and there could be political concerns. Not sure we have salvation coming out of China for our US economy, or US equities, anytime soon. Nothing dramatic in the morning's news otherwise. Lots of street violence and shootings, which is bad but not necessarily relevant for equities. Ukraine is making gains against Russia, and Russia took Ukrainian soldiers prisoner. Looks to be a balanced day in the war. Bonds were interesting. We saw strength yesterday in corporate bonds at ~1.7 advance/decline in the investment grade category. High Yield and Convertables were ~ 1:1 advance to decline. New lows are still 25x new highs, but at least we saw strength. In US Treasuries, we see lower yields across the board. Long rates are not rising...the market is not ready to pick up rates. This is bullish. The VIX, or fear gauge, is down again. We had a period from April 25 to May 12 where the vix went above 30, and stayed there almost the whole time. Today it is back to 26, which is bullish for equities. Finally, one thing to remember. Friday is the day when many options expire. It is possible that what we are seeing is that many traders and money managers had BIG bets on the downside that expire on Friday, and they are selling or closing those positions. This morning's rally could be a removal of bearish or put bets. In closing, we looked at our canary in a coalmine industry sectors, and in almost every case almost every stock was trading higher in pre-market. This is not typical, nor is it accidental. People were making large, broad, bullish bets before the market opened. The market is now open, and let's see if that intention (or signaling) has been maintained. Good luck to all GLTA!
0 Comments
By Jeffrey Cohen, Investment Advisor Representative US Advanced Computing Infrastructure, Inc. 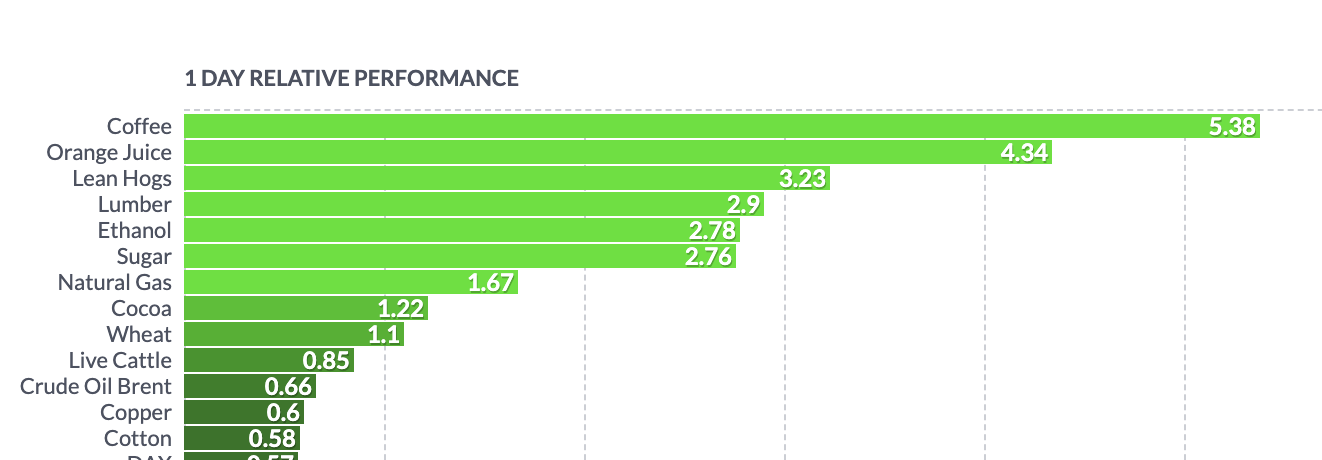 Food and energy prices rose dramatically today. This, along with a 2 or 4 cent increase in the wholesale price of gasoline today, means a much higher food bill for regular Americans. Think about sugar, wheat, orange juice, cocoa, cotton, coffee, lumber, gasoline, heating oil, natural gas, ethanol, pork and beef all becoming significantly more expensive in one day.
We need to fix this. When inflation is running at 8.5%, but coffee goes up 5.38% in one day, inflation is set to rise faster and farther than we expect. Most average Americans don't follow the futures markets and will only feel the sting of higher prices at their next grocery store visit. Hello all, we have tweeted about different asset classes today. Bonds likely down further, gold and oil up, gasoline too 'damn' high, and VIX and USD down a little.
However, what do we see in the US stock market today? By way of context, we see downward pressure on the market, and just read that foreigners have been selling US equities in March 2022 (half of the net selling for the year ending March 2022 happened in march). We see FED tightening (threatened, but not yet started), and higher rates. We see a downward spiral of equity and fixed income prices. Yes, bonds are down too. Firstly, today was a good day for us personally. Our three stocks all rose today (thank goodness, we have lost ~15% in the past 2 weeks, and this brings us back to only a catastrophic loss). Key indicator industry sectors: Money Managers: down mostly Specialty Retail: down mostly Crypto: down Physical miners: up mostly Cannabis: (the stocks that went up, went up ALOT, but mixed overall) Chips and Semiconductors: down Trucking and transport: down, mostly Personal computers: down, mostly Stonks: (shitcos) are mixed (but with large moves either up or down. Some big swings) Quantum computing: down Overall, our canary in a coalmine stock sectors were down today, which supports the fall in the three main indices: QQQ: -1.2% IWM: -0.52% SPY -0.39% Our currently efficient portfolios 7 stocks: Median return -2.5% 11 stocks: Median return -2.5% This is 8x worse than the $SPY. It was not a good day for efficient stocks (lower risk, higher reward - or lower price variance & higher BETA) It was a good day to be out of the market, because even a hedge against the SPY would not have rescued today's efficient portfolios. Our strategy for clients: FOMO is a cost effective strategy. However, if you were lucky to be in just the right stock, you rode the low levels of liquidity higher. Our personal portfolio of 3 US common stocks (~3.5% of assets) rose 11.4% today, and is only down 40.9%. FOMO keeps your cash (and yourself) dry and ready for when market conditions change.
By Jeffrey Cohen, Investment Advisor Representative
US Advanced Computing Infrastructure, Inc. May 16, 2022 This is not investment advice.
S&P 500 is trading around 4,000, which is a support level set at/over a year ago. Last night, Goldman Sachs and Morgan Stanley called a year-end level of 3600 and 3400 if we are heading into weaker earnings cycles. There is a 10% to 15% downside risk in the next 7 months in the fully diversified US stock market according to the large money managers and market makers. These investment managers 'read tea leaves.' We don't guess the direction of the market, we find stocks that should benefit from rising or falling markets.
BTW, the tea leaf readers analysis makes sense to us, because as more stocks swing from profit to loss (positive to negative net income), there will be more big (and unexpected) losses in individual stocks. We watched the US stock market futures move from positive to negative this morning, which indicated a lower stock market open. It is still lower as we write this, about 1% across the board. There was news last night from China. China's economy was significantly weaker (it shrunk) in April 2022. This was due to COVID lockdowns (their explanation) and global economic conditions (ours). We also see a continuing weakness in US bonds. We looked at the WSJ Bond Benchmarks and saw all fixed income is priced lower. Mortgage backed securities are down 8%, US government agency and Treasury debt down 10%, and corporate bonds are down 15%. The longer the duration (or years to maturity of the money you get back, on average), the worse the loss. We are invested in fixed income, and likely so are you. This shows there is no place to hide. Stocks and bonds are both down. We see the US Dollar is strong, and continues to show signs of strength. There is a flight to safety into US assets. The VIX is down slightly, down to 28 (from the 30s), and while this is still elevated, it shows a lower risk of catastrophic market drop than 1-2 weeks ago. Oil and gasoline are too high, and maintaining their elevated levels. We commented now this morning gasoline (wholesale) rose 2 cents to $4.00 a gallon while we watched. This is the price before taxes, shipping to your gas station, and dealer markup). This just isn't right for normal Americans who drive to work. This will hurt our economy and consumer spending. Years ago we studied this and could prove that a dollar spent at the pump is exactly a dollar less to spend in the general retail business (especially food and clothing). Our smart volatility model (Efficient Portfolio) called Chicago Quantum Net Score UP model, is showing a 20% greater edge than last week on slightly fewer stocks. The best portfolio has 7 stocks, and the same edge (within 10-4 rounding) can be maintained with 11 stocks. It is starting to be time to think about that 'buy list' for the long side, as these 'efficient stocks' will scream higher in a market recovery.
We discuss The Carlyle Group $CG having good news.
We discuss the extremely negative breadth of this market. A month ago, markets were significantly higher. If you were out a month ago, you would have more money. A year ago, the markets are lower, but it is a mixed bag. Some sectors have over-performed others, and so industry investing matters. Futures this morning:
Reasonable setup for a good opening on Monday. News articles were either not news, or 'gloomy Goldman.' Fallon says this is starting to be a buyers market, and he suggests small caps if you are ready to take the risk. Negative BETA stocks is the hot topic on our website. Most visited page is Negative BETA stocks that we share. There are very few negative BETA stocks, and a few exchange traded funds (or synthetic investments) that offer investments that tend to move in the opposite direction to the $SPY or S&P 500 Index ETF. Our data shows the US Dollar, and physical gold both have slightly negative BETA to the S&P 500. A good bet 'for' the market that should rise when the market rises, take a look at $TNA. This should rise with the market, as it rises when the market rises, on a leveraged basis. $CRBP Corbus Pharmaceuticals is looking up today. Nobody knows how this will do, and we call that this stock could hit $0.20 again today. It is at $0.26 right now, up around 25%, this morning. We reviewed some common sense 'wisdom' from David Goldman, CNN Business published on Saturday, May 14. Why are markets lower? Rising interest rates, stock market is in sell-off mode, bond market is in sell off mode, and there is chaos around the globe. Fixed income is lower, especially in corporate investment grade issues. High yield is already lower, and now corporate debt is falling. Many more new lows than highs. Across the board, whether mortgage backed securities, Treasury or Agency debt, corporate investment grade, or high yield are down 8% to 15% depending on where you invest. In this case, stocks and bonds are both down, and there is no place to hide. Dollar is strong, inflation is high, and people are running into US Treasuries, but they cannot overcome rising long-term interest rates. $AMC Bonds trading under $0.70, yielding almost 22%. AMC is the movie company. We just went to the movies, and the theatres were full, but their debt is junk. Yield curve is trending higher, it is positively sloped, and slightly above and below 3%. Short duration bill yields are down. We review industries trading pre-market. Some of the risky sectors of the markets are up, but most are down or mixed. Risky sectors were mixed pre-market. This helps you to see beyond the headlines. Chips and semiconductors were mostly red, which led us to believe the market would open lower. It did. The physical miners are mixed, and we like those companies. Not sure we like those stocks at those prices, but we like them. Overall, it looked like the market was in individual stocks, and not a big push to drive the indices into the open. A stock pickers market today. Finally, we tweeted an existential stock market thought this morning just before the open. If there is an event horizon where stocks move from trading ranges into freefall, what is that level. Is there a stock trading shop that wants to try and push us to that level and watch the ensuing chaos?
Key Links from this morning's analysis:
https://www.markets.fallondpicks.com/2022/05/markets-make-fresh-attempt-at-swing-lows.html https://www.chicagoquantum.com/negative-beta-stocks.html https://finance.yahoo.com/quote/TNA?p=TNA&.tsrc=fin-srch https://www.zerohedge.com/markets/hedge-fund-cio-markets-strongest-gravitational-force-produced-stop-losses-imposed-leverage https://finance.yahoo.com/ https://finance.yahoo.com/news/goldman-sachs-economist-slowdown-consumer-spending-151957462.html https://finance.yahoo.com/news/china-april-industrial-output-declines-020031783.html https://finviz.com/futures.ashx https://finra-markets.morningstar.com/MarketData/Default.jsp?sdkVersion=2.62.1 https://finra-markets.morningstar.com/BondCenter/Default.jsp https://www.wsj.com/market-data/bonds/benchmarks?mod=md_bond_view_tracking_bond_full https://www.cnn.com/2022/05/14/economy/recession-signs/index.html https://www.cnbc.com/2022/05/16/china-economy-covid-lockdowns-weigh-on-retail-industrial-production-data.html https://www.zerohedge.com/markets/price-wrong-morgan-stanley-says-bear-market-wont-be-over-until-one-two-things-happens https://www.zerohedge.com/markets/one-step-closer-recession-goldman-cuts-sp-price-target-4300-slashes-gdp-forecast
By Jeffrey Cohen, Investment Advisor Representative, US Advanced Computing Infrastructure, Inc.
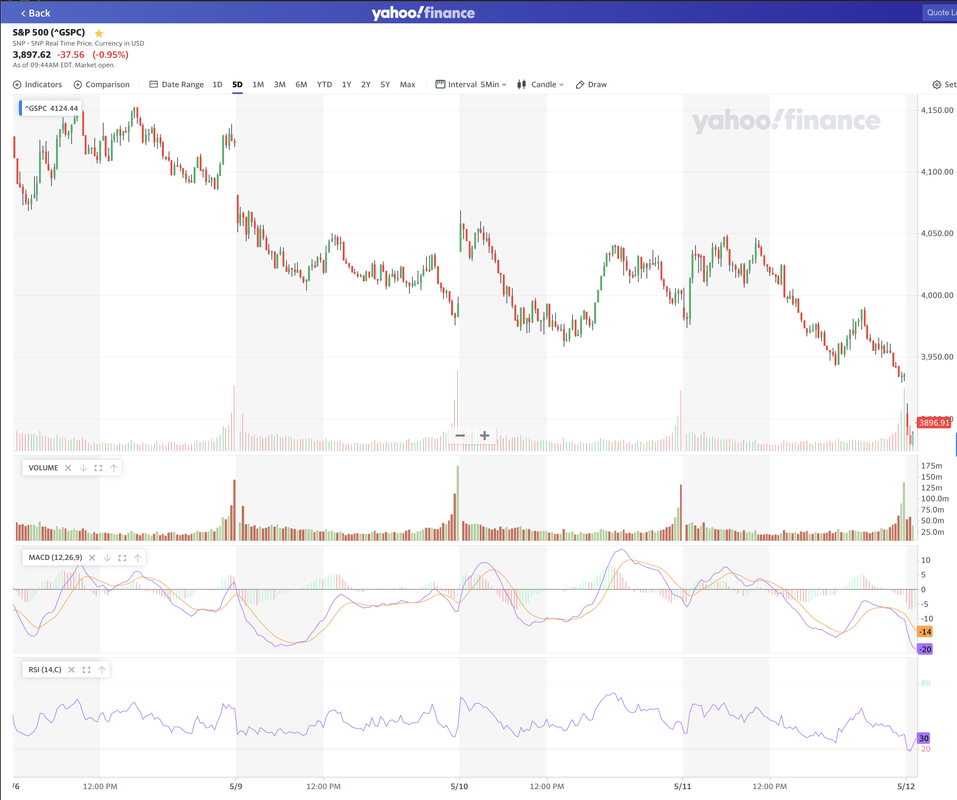
May 12, 2022, 8:35am CT (market just opened) We have had two major downturns in the market over the past 20 years. The first was in 2007 - 2009 and we were alive and trading and investing at that time. We lived through it, although without any social media, so we just read the WSJ (seriously) and The Economist and The Chicago Tribune for our news. Market drops were learned about the next day, at about 8am if we had time, or mid-morning during coffee in the office. That downturn lasted over a year. It was a fundamental shift in market valuations. It changed things. The next downturn was when the COVID 19 pandemic hit in early 2020. This hit quickly and in a few months was over. These are our choices...a long steady drop and slow recovery, or a quick 'flash crash' and almost equally fast recovery. 
We do not have a functioning crystal ball, and our Magic 8 Ball has gone missing. We don't know what is in store for this market. However, we see 3 gaps at open in the past 5 trading days. This represents a significant movement, and interestingly not all gaps were down this past week.
We are learning a great deal in this market. We watch it every day, full time. This is our work now, we study the market, run models, do quantitative analysis, and manage a small portfolio. Sometimes we do more 'technical' things around quantum computing, but lately it has been 90% stock market and 10% quantum computing market. This ratio will change over time.
The variance of money losing company stocks is greater than the variance of money making company stocks by a factor of almost 3:1, and the variance of all 1,960 US listed profitable stocks that traded every day over the past year and had a market capitalization of over $500M (held evenly) had a variance of about 1/3 greater than the variance of the $SPY, or the S&P 500 Index ETF.
Expected return of money losing stocks is 6.56% and money making stocks is 4.95%. In a recession, more stocks slip from positive to negative net income. This means they lose money, their prices fall, their variances rise (so they trade more & lower). Their expected returns are higher if you bought it after it lost money. Also, the CQNS power of our model is below 3%, which means our model is working very hard to find ways to reduce variance because the expected returns go down. The $SPY is still a very risk-efficient way to hold exposure to the stock market. We see something strange in the yields on 10-year US Treasury Bonds. The prices of those bonds are up all week, and the yields are down. In fact, this morning the yield dropped 6 basis points to 2.861%, when inflation is running over 8%. 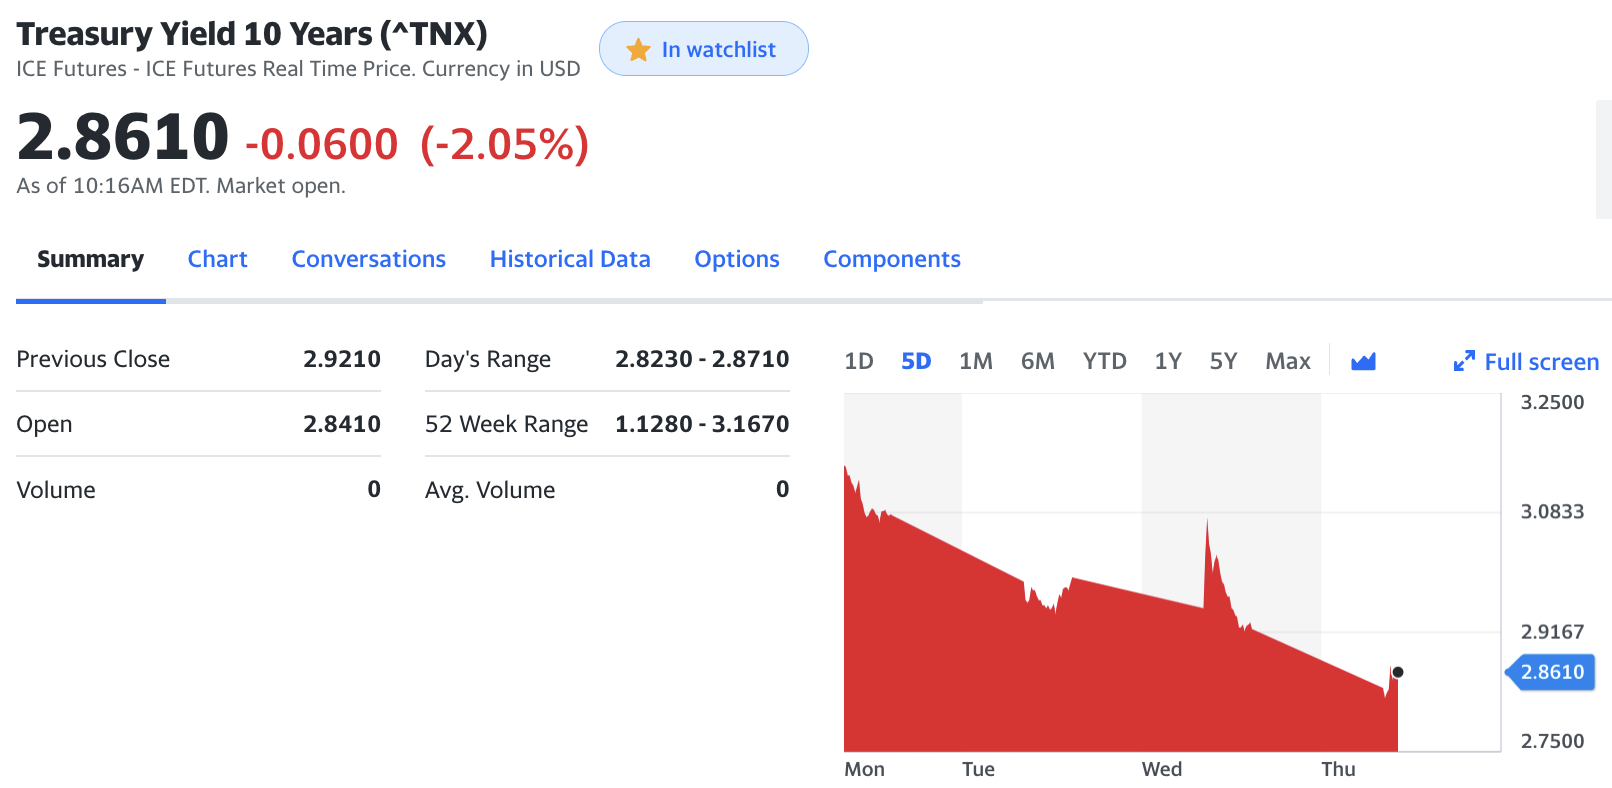
Negative BETA stocks remain in the market, but there are fewer of them. One notable exception is $K or Kellogg. This is a cereal company, and likely they are able to raise prices and keep ahead of inflation.
Reminder, we don't bet short, or profit when the market falls. We don't bet against the market.
We found something intentional about the fall in stocks that are already down. Their level of net income in the most recent SEC filing matters. The data may have a lag due to overhead by our market data services provider.
Positive net income stocks that are down the most over the past year have a mix of high and low volume trading levels yesterday when compared to the average over the past year. There is a mix of blue and yellow (blue have >2x volume, and yellow have <1/2 volume). This appears to continue over the ~200 stocks with the largest declines in both lists. Positive net income stocks have a mix of high volume and low volume action. Negative net income stocks only have positive volume, sometimes punishingly high volume of 10x or more, and so their price drops appear intentional and driven by conviction. The contract is stark and clear. If you are holding stock in a negative net income company that has already fallen, you should assume the selling pressure, including shorts, are coming for your stock further. If you have profitable stocks, there is a chance the market will overlook your company. This could have something to do with debt and leverage, and the risk of bankruptcy of companies in recession. This is some of the data behind our concept of FOMO: A Cost Effective Strategy (in today's market). 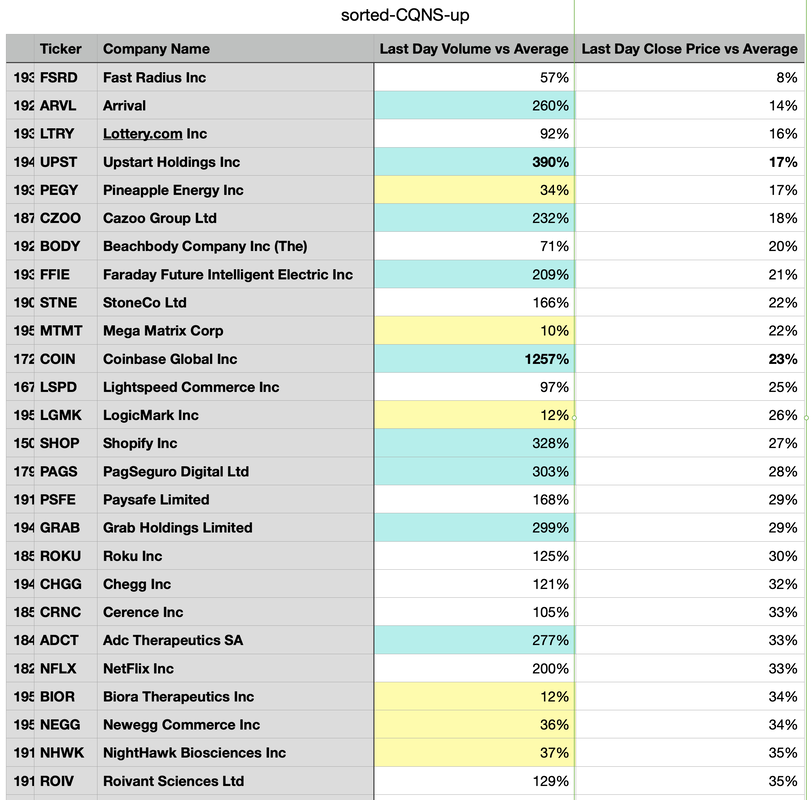
These are stocks with positive net income (blue is higher volume, yellow is lower volume)

These are stocks with negative net income (blue is higher volume, yellow is lower volume)
Finally, we dig into inflation data and our magic equation that describes inflation in the USA: M*V = P*T. Net-Net: The US Treasury Department is doing a little to control inflation, but the Federal Reserve Bank is not. If we can promote US economic activity, we can still grow our way out of inflation (but it would require 8% more economic activity).
By Jeffrey Cohen, US Advanced Computing Infrastructure Inc.
Here is what we saw in the markets today, pre-market.
Our market 'edge' is higher by 25% on our top portfolios. It climbed from 4 x 10⁻⁴ to 5 x 10⁻⁴ over the S&P 500, Nasdaq Composite 100, Russell 2000, and buying and holding all profitable stocks today. This is good news. We are seeing some semiconductors, money managers, and large-cap tech growth stocks, but new information we are seeing more 'regular economy' stocks at the top of the list. Main-street companies like McDonalds and Accenture must be flattening out. 1. The business news was universally negative in regards to the 'main street' economy. - Mortgage rates are up which means smaller house purchases, or faster pre-payment - Inflation was 'down' at a headline number of 8.3% - Russia is gearing up for a more protracted war effort - The US is spending another $40B in aid to Ukraine - UK considering a windfall profit tax on energy producers 2. Company stocks individually are being punished for suffering from economic weakness in their quarterly earnings. We saw this with $UPST or Upstart, which is seeing softer loan origination, and softer demand for completed loans by banks. We see this with $GRWG or GrowGeneration, which is seeing sales drop and now shrinkage. This swung them from profit to loss. $RGS Regis which cuts hair and makes people beautiful is doing all the right things to cut costs, but they are selling less product and seeing less revenue (on the front lines - haircuts). $PRTY Party City has less store traffic and is suffering from higher transportation and in-store costs. $ATIP ATI Physical Therapy continues to drop, as a hands-on services firm operating out of strip malls, along with so many other stocks. 3. Market Breadth is weak. Many more new lows than highs (~1:48 ratio), and < 20% of stocks are trading above their 50 day and 200 day simple moving average (SMA). We discussed how most stocks are lower than they were 2.5 months ago as well as 10 months ago. Most stocks are lower that regular investors bought over the past year. 4. Politics is heading up as we head into elections, and this gives us much less confidence that real actions will take place to fix our 'main street' recession problem. Regardless of your politics, our President of the United States is blaming Republicans, making $30/month give-aways to eligible households, and seems to be talking up war, class warfare, and his 'let's tax the rich and give to the poor' rhetoric. This does not help solve the real issues we face. Our Federal Reserve Bank is acting prudently and conservatively, and potentially much too conservatively, but they are doing it to minimize pain in the markets and on main street we believe. 5. Futures were up much higher. Screen was very green. However, we did not see much conviction in the readings. In fact, during our video the futures on US equities went from Green to Red, or up to down. We still don't see the conviction in prices rising. 6. It is starting to sink in that Russia's reason for their pre-emptive war in Ukraine had grounds in NATO boosting up Ukraine, Ukraine indicating it wanted to possess nuclear arms again, and that Ukraine indicated an attack on Russian controlled border areas was planned. Russia asked the West for a renegotiated peace treaty to ensure its border safety and I remember at the time that it seemed to be laughed down and dismissed out of hand without any concessions being made. Russia may be in this for the long haul, replaying their Cold War and Post WWII playbook, unless they are either made to feel safe, or are disarmed. 7. The VIX, or the cost of downside protection for US Equities, was down this morning (-6%). It is inversely correlated to US equity prices, but not exactly. However, it is still very elevated at 32.52, and the market 'PUT' protection is still expensive. This is very expensive, and indicates large traders and money managers are spending premium to protect against downside risk. This is bearish for the market in some circumstances, and indicates 'big money' is still spending to defend against an unexpected market drop. We are still at insurance premium levels from previous market declines. 8. Crude oil delivered at WTI (or Texas), was down to ~ $100/bbl. This indicated a lessening of demand globally. When we look now, about 5 hours later, it is at $105.90/bbl. This is a 6.15% increase today which is a massive move historically. 9. Crypto continues to trade down. We see this as another asset class for speculation. When bitcoin and crypto is down, it means that incremental money is not entering the market and the currency is sliding on lower interest in betting. It is an accelerant to the US Equities markets. At this writing, Bitcoin is down 3% to 30,295, and 150 crypto currencies are trading down 50% or more today. This is a very large move to the downside and will clean out many wallets (pun intended). We also notice that crypto-related stocks and business are also lower, including $COIN Coinbase and $SI Silvergate Capital. 10. We are not 'technical' analysts, but we do stare at the charts sometimes. Here is what we saw this morning. - S&P 500 has been going lower, with lower lows and lower highs. This is not a positive story. - The Russell 2000 has been in a steep decline for quite a while now. - the Nasdaq Composite 100 has been in a steep decline for about 1.5 months, after trying to rally. Large cap tech stocks are also flat to lower without positive momentum. Flat trajectories in large cap stocks could create a feeling of safety but it could just be mechanical, passive money flows. Every time a retail investor puts money in their 401K, some of it goes into the large-cap growth stocks. 11. In the video we also discussed inflation. We published an article on inflation just about a year ago in Medium (under Chicago Quantum) which discussed how inflation is caused. We also lay out how our US government officials can combat inflation quickly, efficiently, and effectively. Here is the tweet we highlighted during the video. 12. There are negative BETA investments if you want to bet against the market, or hedge market downturns. We discuss US Dollar, Physical Gold, Short QQQ and VIX ETFs that can be purchased like regular stocks. These are very risky, so please be careful and only invest what you can afford to lose.
Our main point in the video, and across our social media, is that FOMO is a low-cost strategy. Stocks that are lower will likely be lower still in a week or two. We are not adding our money into the market today. However, we are building our buy list, and you should be too, to figure out what to buy when the market stops falling.
By lunchtime, the US Equity markets are all lower, all RED. We were not wrong, this market lacks conviction and you should keep your powder dry. GLTA! By Jeffrey Cohen, Investment Advisor Representative There is still a lack of forgiveness in the market today. Upstart Holdings, Inc. $UPST, was one of the CQNS UP run stocks a few weeks back. It had great BETA values and has recently flattened out. However, today, it is down 56.83%. 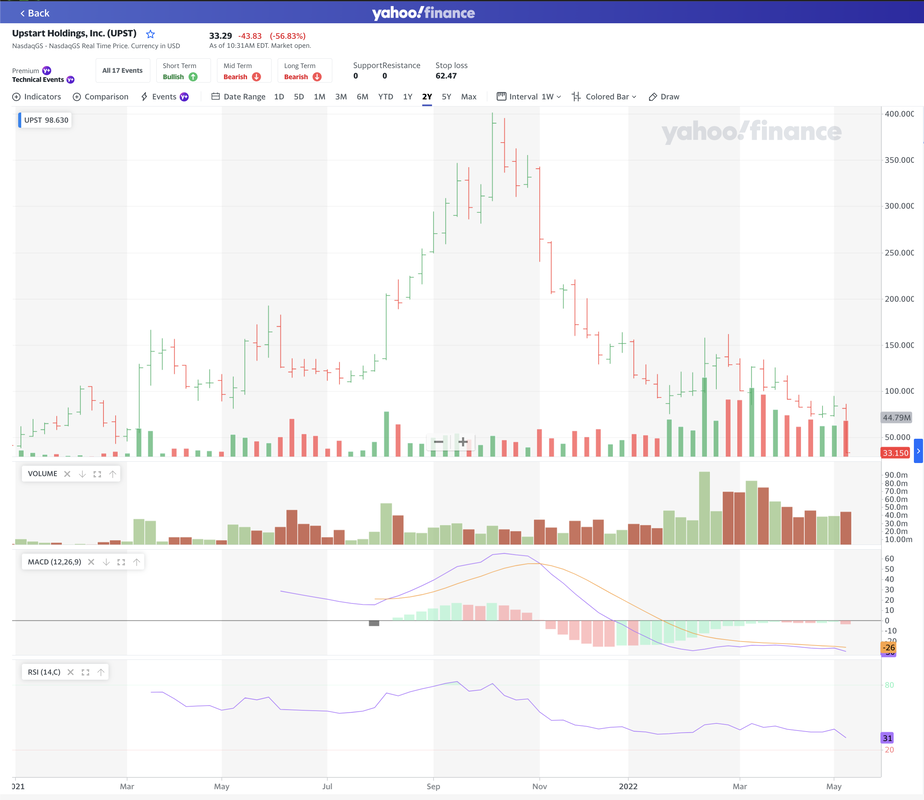 Yesterday we added railways, shipping, delivery, and logistics to our Trucking index for a broader footprint. We are to 20 companies. Today, 16 of the 20 are down, on an otherwise up day. Chips and semiconductor stocks are 100% higher today. As we flipped through our other industry sectors, and even our 'current efficient portfolio' that we updated yesterday, we see mixed results. That says to us that today is not 'in the bag' as an up day. There is not the supporting stock breadth. Finviz says we have a high advancers / decliners ratio, but a low new high / new low ratio (see below). Be careful out there. Do not invest more than you can afford to lose. GLTA 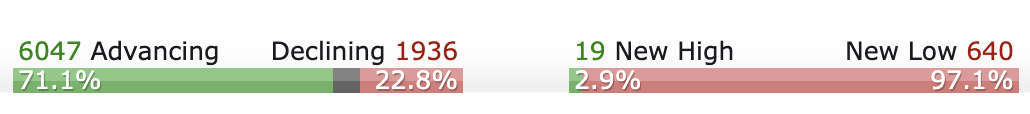 By Jeffrey Cohen, Investment Advisor Representative Each night when we run our models we can see the return of the three major US Equity indices we track, the $SPY, the $IWM and the $QQQ. We look at them simply, comparing the close a year ago to the close today, and calculate the difference. Dividends are excluded, and range from ~0% to 1.32% for the $SPY.
Riskfree rate = 1.00% Actual SPY return = -4.43% Use floor S&P500 rate = 5.00% Actual IWM return = -21.81% Use floor Russell 2000 rate = 5.00% Actual QQQ return = -10.66% Use floor NASDAQ 100 rate = 5.00% =========================================== Market return = 4.00% Our expected return from the market moving forward is 4%, which is based on a floor rate of return of 5% for the indices. We ran our CQNS Down model last night. There were 644 stocks and of note, Draft Kings Inc, $DKNG, has the lowest BETA of 0.048, and Marathon Digital Holdings Inc $MARA has a BETA of 3.46. The expected return of the down run stocks is 6.49%, and had a variance of 3.8 x 10⁻⁴. This compares to a $SPY variance of 1.2 x 10⁻⁴. We do notice some interesting volume action. Some stocks are trading at less than 10% of last year's average volume, while other stocks are trading at 300% or more of last year's average volume. At the extreme, a few stocks are over 500%, and those stocks may be in play. We also have stocks that are down 70% to 90% from their average trading prices over the past year. These are significant declines, and there are a few familiar names in the list. Bottom fishing targets. On the other hand, we also have stocks that have appreciated from 30% to 114% over the past year. These may still run, or are reflecting a new macro-economic trend (e.g., oil and gas prices). We have positive and negative SKEW stocks. Not sure how to analyze them, but I would expect returns may be correlated to extreme skew stocks. We have another filter to find either leptokurtic and low variance stocks (there are either 3 of them, or 10 of them, depending on how tight we set the variance levels). These stocks have had fewer extreme daily price changes and tend to cluster more around the mean return. In our experience, they are less risky during extreme price movements. However, they can still move. We also see stocks that are platykurtic with high variance. We set our variance filter to catch 20 stocks that are both platykurtic and exceed a certain multiple of the variance of the all stock portfolio. These stocks have had larger price swings around their mean returns, with both significant advances and declines. I recognize a few of these stocks as story stocks and active stocks. One is a uranium miner, one a bitcoin miner, one drills for oil, one looks for vaccines, two electric vehicle industry suppliers, and one wants to export liquid natural gas, and one is a cannabis brand. Those examples are volatile based on company-specific factor and external commodities or political factors. These would have more volatility than leptokurtic and low variance stocks. We also identified stocks with one-day volume spikes, and stocks that rose and fell significantly in a single day. In a way, these stocks may have been 'blown out' and not trade in normal patterns for a while. Finally, we have negative BETA stocks, low BETA stocks, and high BETA stocks identified by our model. The high-BETA stocks are typically tech or new industry stocks which may require some 'belief' in their stock valuations. We see bitcoin miners, an ecommerce firm, a cloud services provider, a car dealer, and a quantum computing firm. For the low BETA stocks, we have utilities, REITS, and some speculative names, along with a more industrial set of firms. We note the speculative names, because these may be moving based on specific company specific, or investor-driven sentiment and detach themselves from the movements of the overall market. We have two negative BETA names in our CQNS down run. These are highly speculative names. Finally, we have identified all of the stocks with dividend yields actually paid over the past year that exceed a certain level. We use the 'actually paid' dividend model and compare it to the average share price over that same time period, to reflect what an investor actually earned during that period. It is different than a forward-looking dividend yield. In today's run, higher yielding stocks were either investment companies, REITs, oil and gas MLPs, and a shipping company (likely a cash windfall from rising shipping rates). Have a great day in the markets today. GLTA The market had a very down day after weeks of down days. The S&P 500, Nasdaq Composite 100, and Russell 2000 were down 3.2%, 4.3% and 4.2% respectively.
Oil, Natural Gas, Copper, Gold, Silver, UST Bond yields (2,5,10 & 30 year), and Bitcoin / USD were also lower. The US Dollar, the VIX and a few commodities were higher (Ethanol, Palladium, live cattle and some of the grains. Market breadth was heavily weighted to stocks declining. 1,085 advancing to 7214 declining (not all US-Listed Common Stocks), 55 new highs vs. 3136 new lows, 13% of stocks above the 50 day SMA, 17% of stocks above the 200 day SMA, and the S&P 500 had only a few significant winners (4 rose 3.8% or higher) while it looks like at least 40% of stocks fell 3.8% or more. The other interesting things we noted today: - There was no news, at least nothing significant. I tweeted about the President of the United States focusing on his most important initiative (this made the headlines and the White House website). He arranged that 'for profit' telecommunications companies will give $30 / month off eligible households spend on high-speed internet, and that many of them will offer $30/month plans to those same eligible households. These are households with limited or no income, and that typically receive other forms of support (e.g., SNAP EBT or rent support). This is good charity / welfare work, but is hardly news to send the market down 3% or more. - The futures were down in the morning and there was no 'head-fake.' There was a small lunch-hour rally that subsided as quickly as it started. - There were specific stocks that fell on earnings news. One such stock, Party City Holdco, $PRTY, we used to own. It fell to $1.18 today, down 61.44%. Now, to be honest, the news was not great. They are facing cost pressures and revenue did not keep up with inflation, and they made the mistake of having inflated their SG&A costs. They agreed last year to build a new HQ building, which made for bad publicity in this report. Was it bad enough that this company with $1.5B in debt is now only worth $140M in equity market cap? Not sure it is this bad, but this shows how unforgiving the market is for companies that show signs of strain in our economic conditions and have not taken appropriate action. - Another down stocks is Palantir or $PLTR and another is Boeing $BA. Two more were $Lyft and $Uber. Previously we saw Amazon $AMZN and Tesla $TSLA fall significantly, and going back a few weeks, the GAP $GPS fell as well. There are many negative story stocks. - There was an article that caught my attention on Sunday. There is an ETF that track small capitalization biotech stocks, the $XBI. It is down significantly and the article discussed how many (or was it most) small capitalization biotech stocks were trading below their cash on hand. What they meant in the article is that the long time horizon bet that one of these companies will discover an important cure and pay off like a lottery ticket is worth less now than it was before. The market fear is that these companies will spend their cash, and even if they discover a new drug (or one out of 10 discovers a new drug), it won't be worth it to hold a set of these companies. Therefore, small cap biotech is down. We have experienced this first hand, and see it in the model run results (the CQNS DOWN Run results has many biotech stocks as being not efficient). There is one stock we notice, Dollar Tree or $DLTR. This stock is up ~50% from when the announced they were raising prices by 25% across the board, or the day they became $1.25 Tree. The joke is on the consumer, because their costs are likely up 10% but prices are up 25% and their stores (near us) are full of merchandise and shoppers. Here comes our opinion (not investment advice): We see the US economy, when it has the right political and monetary leadership, as being unstoppable, innovative and just great. We see the USA leading the world in innovation, productivity and high value products. We also see the immense value in our largest trading partners such as China, Japan, Europe (collectively), Mexico, Canada and the rest of the world. The world follows the lead of the United States. The USA still has the ability to create value through its corporations. However, when political and monetary leadership loses the confidence of the investor class, and actions to tighten and shrink the economy are taken, the market takes notice. This has been true since the 1920s, and even well before that. I miss a few of our former US Presidents who knew how to support investors, and hope we elect one again soon. I am in particular thinking about President Reagan, Presidents Bush (Sr. and Jr.), President Clinton and President Trump. This was a day for US Equities markets to test support levels that would indicate a market trend reversal down (which according to the Dow Theory signals a sell for all stocks). What did our President and Vice President accomplish and promote today? They arranged a $30/month discount for high speed internet for needy, eligible households to be given by telecommunications companies by 'volunteering' to create discount service plans, and likely paid for by our tax dollars. This is a welfare program that hurts companies (but progressively helps the poor to watch videos, listen to music and read websites). I read the White House press release and even saw a Tweet from @POTUS promoting it with a video where VP Harris was taking time from her busy schedule to discuss it publicly. What we needed was a President and Vice President that reassured the investing public, and took steps to help business make and keep more profits. We need more success stories and fewer stories of decline like Party City, Amazon and the Gap. To stretch this BLOG even further, US Advanced Computing Infrastructure, Inc. feels strongly that the United States of America needs a more aggressive industrial policy towards energy production. We need to produce more carbon-based fuels of all kinds (oil, natural gas, ethanol and coal). We also need to produce capital-intensive energy that is renewable, including nuclear power, wind and solar, to support new industries like bitcoin mining, electric vehicles, general economic growth, and data centers for internet-based businesses. We need pipelines, many new pipelines, to connect our brothers in Canada with our refineries, markets, and export facilities. Finally, markets are auto-regressive. This means that they take into account what happened in the past to decide what to do in the future. If the markets fall for five weeks, it may be more likely they fall for another week. This has many causes, but I will give you a simple one. My mother (87 years old) and I spoke for Mother's day. She asked if she should sell her retirement assets. I said no, everything should be ok. However, if the market falls for another week and she sees Jim Cramer yell "SELL, SELL, SELL" she will probably have her investments liquidated. A few final thoughts: Never catch a falling knife. FOMO is a cost effective strategy right now We do not know whether the market will go up or down tomorrow We are building our buy-list for when we think the market is ready to rise again. Best regards, Jeffrey Cohen President, US Advanced Computing Infrastructure, Inc.
$PRTY Party City Holdco Inc.
https://www.sec.gov/Archives/edgar/data/0001592058/000095017022008228/prty-ex99_1.htm Just read the press release (SEC EDGAR SEARCH, PRTY). I used to love this stock, but now the company needs to belt tighten again. I hope it is not too late. On the negative side: Rev growth < inflation, COGS up, SGA up, Debt up, Interest expense up, Capital Expense on a new corporate HQ building, Q1/22 Negative Net Income & negative CFFO. On the good side, they have until 2025 to pay back or restructure their $1.5B in corporate debt (except for $22M in 2023). BK is likely off the table for now. CEO Commentary (verbatem): Brad Weston, Chief Executive Officer of Party City, stated, “We are pleased to deliver another quarter of topline growth with a sales increase of 1.4% and brand comp sales growth of 2.1%, despite a difficult consumer backdrop with the Omicron variant earlier in the quarter. As expected, our bottom line results were impacted by elevated costs, including greater than anticipated freight and commodity cost pressures that ramped later in the quarter. Amidst this choppy macro environment, our teams are doing a good job executing against our strategic priorities of ongoing enhancements to customer engagement as well as digital, IT and supply chain, in support of our purpose to inspire joy and make it easy to create unforgettable memories.” Mr. Weston added, “As we look to the remainder of 2022, we expect supply chain and inflationary headwinds to continue, which is reflected in our updated outlook. While we navigate this near-term turbulence in costs, we are being very thoughtful with our mitigating actions on the pricing front, along with delivering an improved customer experience. To that end, we remain focused on executing against our strategic priorities, which we are confident will even better position Party City to drive long term growth and shareholder value.” We think this quarter's results were accented by the reference to their new HQ building. This is the total opposite of what a specialty retailer needs to be worried about during periods of high supply chain costs, supply disruptions, inflation, pandemic, war in Europe, and the risk of recession. They should save every penny (outside the stores) that they can. When debt is $1.5B and equity market cap is ~$0.2B, the party at HQ should be over for now.
By Jeffrey Cohen, President and Investment Advisor Representative, US Advanced Computing Infrastructure Inc. Update: Markets have been open one hour. All US equity indices are down significantly. Our leptokurtic and low variance stocks are a safe haven, down less as a group than the $SPY (see image below). Our efficient stock portfolio (UP RUN) is down significantly, both the small portfolio of 8 stocks and the larger one at 25 stocks. Median daily return after 66 minutes is -6.14% for the larger portfolio, and -6.69% for the smaller portfolio. While we typed this BLOG post, the markets fell further. Our Proprietary Industry Indices that are down this morning:
Trucking is mixed. We are updating our trucking index to add freight railroads. 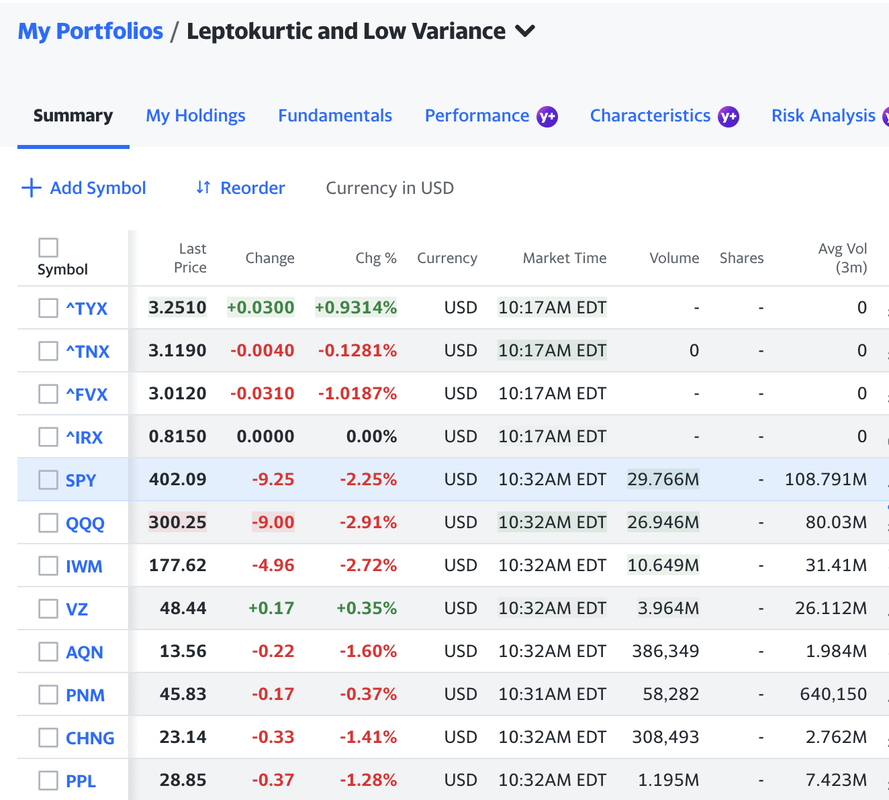 If you compare Friday's close to the average of the adjusted closing prices for the past year: $SPY -0.55% $IWM -17.35% $QQQ -6.27% Our model's expected return for all stocks for next year: 4.00%. $SPY Closing price variance: 1.137 x 10⁻⁴ CQNS Down Run Analysis: 668 Stocks net income < 0, $500M market cap, positive BETA, & passed data validation. Expected return: 6.33% for all 668 stocks. Price variance 3.553 x 10⁻⁴ If you want BETA, $TNA gives efficient BETA exposure. Most efficient money losing co. stocks: $SQ $MRVL $TU $COHR $CDAY Least efficient money losing co. stocks: $LWLG $ZY $DCPH $BBIO $VTNR Best combination of shorts (when trading up): $LWLG $ZY Only 2 Negative BETA stocks of money losing companies: $FATH $SES. Very few money losing stocks paid dividends over 5% $ECVT $GOGL $ORC $IVR $NS $SWI $SFL $SBRA $INSW $PBA $BRSP $GEL $TU $PPL $FTAI High dividends paid (possibly one time) and currently earning negative income. Money losing stocks that have fallen in price (bottom fishing candidates down 71.5% or more vs. last year's average close): $ZY $FUBU $TRHC $BBIO $CVNA $SKLZ $PTON $NVTA $BAND $DOMA $GENI $NEO $FTCH $RDFN $TSP. Money losing stocks that have risen in price (up MOMO with velocity): $SRRA $BORR $LNTH $NEX $CRK $AR $KOS $OXY $TH $NEXT $EQT $VTNR $GLNG $APTS $TWI $VAL $SLCA $PTEN Our model & DD picked some of these last year. Lots in Oil, Gas & Midstream. A REIT too. Low volume names (negative net income): $CUEN $ENTX $YVR $PYR $SSKN $BBAI $GSAT $SAVA $SDC $INNV $WBX $MVST $MVIS $SWBI $CLOV $GEL $EVGO $WISH Volume down at least 63% vs. last year's average volume. High volume names (negative net income) - in play? $RADI $AVLR $GH $TCX $BILL $PACK $BHC $W $DASH $CVNA $LYFT $RDFN $SAIL $ZG $TXG $CORZ $WMB $PMVP Volume of 383% of last year's average volume, or more (up to 884%). All > $500M equity market cap. CQNS UP Run Analysis
1,966 stocks have market capitalization of $500M and above, positive net income, and passed our data validation. They have an expected return of 4.94% (~1.2 BETA x $SPY over 253 trading days), and have an equally weighted closing stock price variance of 1.379 x 10⁻⁴. Most efficient individual stocks: $LSCC $NVDA $MXL $APH $CG $TRMB $MSFT $GOOG $AMP $AAPL $ANSS $GOOGL $BLK $SNPS $KEYS $CPRT $TROW $AVGO $BX. Least efficient individual stocks: $CPK $QIPT $HUT $TROO $NEGG $ERO $ARQQ $FRGE $LGMK $MTMT $UONE $BTU $EQOS $GGE $CAR $GRAB $UONEK $CHGG $GLS $FFIE Stocks that have declined the most from last year's average price: $$FSRD $CZOO $ARVL $PEGY $LTRY $STNE $MTMT $FFIE $LSPD $SHOP $LGMKk $PAGS. These stocks have fallen at least 65.8%. Stocks that have advanced the most: $FRGE $AMR $CEIX $PBF $HPK $ARCH $UAN $SD $ARLP $LXU $CVI $GTE $VET $DVN $CVE $NRP $MRO $VLO $RES. Many of these are in energy (Oil, Gas, & Coal). These advanced at least 63% over last year. Our heuristic solvers found the most efficient portfolio and reach equilibrium on it. It is 8 stocks for a 4.5 x 10⁻⁴ edge today at market open. These are consistent names and should rise quickly if the $SPY advances. There are ~25 portfolios with the same edge (within 1 x 10⁻⁴ rounding), and the largest has 25 stocks, held equally in a portfolio. This is the best way to diversify your portfolio to maintain BETA exposure, but reduce price variance. We found individual stocks with Negative BETA in our run: $BTOG $IHS $K $NEM. We also found ETFs that deliver negative BETA: $AAAU (physical gold) $SQQQ (short QQQ fund) $UUP (US Dollar fund) $UVXY $VIXY (VIX short-term EFT) Profitable stocks that delivered the highest dividends last year (at least 5%): SHEN Shenandoah Telecommunications Co. 1.69 ZIM Zim Integrated Shipping Services Ltd 1.49 PEGY Pineapple Energy Inc 1.27 RMR RMR Group Inc (The) 1.27 AFG American Financial Group Inc 1.24 VMW Vmware Inc. 1.22 SBLK Star Bulk Carriers Corp 1.20 LPG Dorian LPG Ltd 1.16 IEP Icahn Enterprises L P 1.16 QRTEA Qurate Retail Inc 1.15 USAC USA Compression Partners LP 1.14 FSP Franklin Street Properties Corp. 1.13 CVI CVR Energy Inc 1.13 DHIL Diamond Hill Investment Group Inc. 1.13 KNOP KNOT Offshore Partners LP 1.13 DMLP Dorchester Minerals LP 1.13 KEN Kenon Holdings Ltd 1.13 ARR ARMOUR Residential REIT Inc 1.13 GLP Global Partners LP 1.13 FLNG Flex Lng Ltd 1.12 UAN CVR Partners LP 1.12 MPLX MPLX LP 1.12 MTMT Mega Matrix Corp 1.12 ICL ICL Group Ltd 1.12 TWO Two Harbors Investment Corp 1.12 RC Ready Capital Corp 1.12 CEQP Crestwood Equity Partners LP 1.12 KRP Kimbell Royalty Partners LP 1.11 NLY Annaly Capital Management Inc 1.11 DKL Delek Logistics Partners LP 1.11 MMP Magellan Midstream Partners L.P. 1.11 CAPL CrossAmerica Partners LP 1.11 PCH PotlatchDeltic Corp 1.11 SUN Sunoco LP 1.11 RTL Necessity Retail REIT Inc (The) 1.11 EFC Ellington Financial Inc 1.11 AB AllianceBernstein Holding Lp 1.11 GNL Global Net Lease Inc 1.10 ARI Apollo Commercial Real Estate Finance Inc 1.10 ORI Old Republic International Corp. 1.10 AGNC AGNC Investment Corp 1.10 AMSF Amerisafe Inc 1.10 CIM Chimera Investment Corp 1.10 SHLX Shell Midstream Partners L.P. 1.10 IFS Intercorp Financial Services Inc 1.10 DX Dynex Capital Inc. 1.09 CFFN Capitol Federal Financial 1.09 ARLP Alliance Resource Partners LP 1.09 KNTK Kinetik Holdings Inc 1.09 NRZ New Residential Investment Corp 1.09 AM Antero Midstream Corp 1.09 RILY B. Riley Financial Inc 1.09 PBFX Pbf Logistics Lp 1.09 BRMK Broadmark Realty Capital Inc 1.09 OHI Omega Healthcare Investors Inc. 1.09 CADE Cadence Bank 1.09 SPH Suburban Propane Partners LP 1.09 ALX Alexander`s Inc. 1.09 ET Energy Transfer LP 1.09 RTLR Rattler Midstream Lp 1.09 GBL Gamco Investors Inc 1.09 EGLE Eagle Bulk Shipping Inc 1.09 SOLN Southern Company 1.08 APAM Artisan Partners Asset Management Inc 1.08 LUMN Lumen Technologies Inc 1.08 VGR Vector Group Ltd 1.08 EPD Enterprise Products Partners L P 1.08 CODI Compass Diversified Holdings 1.08 HESM Hess Midstream LP 1.08 SLG SL Green Realty Corp. 1.08 RFP Resolute Forest Products Inc 1.08 HEP Holly Energy Partners L.P. 1.08 PAA Plains All American Pipeline LP 1.08 MO Altria Group Inc. 1.08 DCUE Dominion Energy Inc 1.07 NYCB New York Community Bancorp Inc. 1.07 T AT&T Inc. 1.07 WLKP Westlake Chemical Partners LP 1.07 GHLD Guild Holdings Co 1.07 WY Weyerhaeuser Co. 1.07 RRR Red Rock Resorts Inc 1.07 CNA CNA Financial Corp. 1.07 ENB Enbridge Inc 1.07 LADR Ladder Capital Corp 1.07 RKT Rocket Companies Inc 1.07 DDS Dillard`s Inc. 1.07 AROC Archrock Inc 1.07 ACRE Ares Commercial Real Estate Corp 1.07 ETRN Equitrans Midstream Corporation 1.07 GOOD Gladstone Commercial Corp 1.07 WES Western Midstream Partners LP 1.07 CMRE Costamare Inc 1.07 BSM Black Stone Minerals L.P. 1.07 LTC LTC Properties Inc. 1.07 MNRL Brigham Minerals Inc 1.07 OMF OneMain Holdings Inc 1.07 BGS B&G Foods Inc 1.07 PZN Pzena Investment Management Inc 1.07 GLPI Gaming and Leisure Properties Inc 1.06 OKE Oneok Inc. 1.06 KMI Kinder Morgan Inc 1.06 BWMX Betterware de Mexico S.A.B. de C.V. 1.06 UWMC UWM Holdings Corporation 1.06 VNOM Viper Energy Partners LP 1.06 ETD Ethan Allen Interiors Inc. 1.06 BLX Banco Latinoamericano De Comercio Exterior SA 1.06 NHI National Health Investors Inc. 1.06 CTRA Coterra Energy Inc 1.06 SIRE Sisecam Resources LP 1.06 MFC Manulife Financial Corp. 1.06 TFSL TFS Financial Corporation 1.06 NRP Natural Resource Partners LP 1.06 NWBI Northwest Bancshares Inc 1.06 OLP One Liberty Properties Inc. 1.06 UVV Universal Corp. 1.06 WMB Williams Cos Inc 1.06 STLA Stellantis N.V 1.06 BCE BCE Inc 1.06 EOG EOG Resources Inc. 1.06 ENLC Enlink Midstream LLC 1.06 BNS Bank Of Nova Scotia 1.06 SCCO Southern Copper Corporation 1.06 TRP TC ENERGY CORP. 1.06 LAZ Lazard Ltd. 1.06 WPC W. P. Carey Inc 1.06 GNK Genco Shipping & Trading Limited 1.06 PXD Pioneer Natural Resources Co. 1.05 SRC Spirit Realty Capital Inc 1.05 DCP DCP Midstream LP 1.05 GTY Getty Realty Corp. 1.05 MC Moelis & Co 1.05 IRM Iron Mountain Inc. 1.05 GMRE Global Medical REIT Inc 1.05 CQP Cheniere Energy Partners LP 1.05 SCU Sculptor Capital Management Inc 1.05 PAX Patria Investments Ltd 1.05 XOM Exxon Mobil Corp. 1.05 CM Canadian Imperial Bank Of Commerce 1.05 CNQ Canadian Natural Resources Ltd. 1.05 VINP Vinci Partners Investments Ltd 1.05 SWM Schweitzer-Mauduit International Inc. 1.05 EPR EPR Properties 1.05 PCGU PG&E Corp. 1.05 OAS Oasis Petroleum Inc. 1.05 CWH Camping World Holdings Inc 1.05 PM Philip Morris International Inc 1.05 KRO Kronos Worldwide Inc. 1.05 FIBK First Interstate BancSystem Inc. 1.05 IBM International Business Machines Corp. 1.05 DEA Easterly Government Properties Inc 1.05 SU Suncor Energy Inc. 1.05 FRG Franchise Group Inc 1.05 VLO Valero Energy Corp. 1.05 FE Firstenergy Corp. 1.05 UBA Urstadt Biddle Properties Inc. 1.05 AY Atlantica Sustainable Infrastructure Plc 1.05 NTB Bank of N T Butterfield & Son Ltd. 1.05 UNIT Uniti Group Inc 1.05 Good luck to all in the markets today.
By Jeffrey Cohen, Investment Advisor Representative, May 5, 2022
Pre-market video was pretty balanced. We discussed how the model analyzed the markets before they opened. I don't think we saw the falloff today coming, but you can be the judge.
We did see that the 'edge' of the CQNS UP Model was smaller, and it took holding from 10 to 25 stocks today to give you a 4 x 10e-4 edge over a fully diversified portfolio of positive net income stocks (or the $SPY, $QQQ or $IWM). Only 2 individual stocks $LSCC and $NVDA scored better than the fully diversified market. Individual stock edges have largely disappeared in this market. There were no dividend stocks which passed our strict criteria. For money losing companies, only two common stocks scored the same or better than than the overall market. $TU and $MRVL. Given the increased risk of these stocks (tends to be ~2.5x more price variance than profitable stocks), the SPY and QQQ scored better than holding a diversified portfolio of all money losing company stocks, by 1 x 10⁻⁴ (the tiniest of edges). How do we understand these results? 1. It is not a stock picker's market, and is better to invest in the indices. We think the large investors and money managers realize this, and this is why the 'action' is concentrated on the indices. 2. Money losing stocks are much more risky than the market right now. We saw something else this week. The CQNS down run is giving us dramatically inefficient scores for the worst, or most inefficient stocks. These are stocks that move without direction. In the market this week, these have moved up and down dramatically as a result. We have a list of shorts based on the CQNS down run in our desktop notepad, and many of them had breathtaking losses. When markets fall and liquidity continues to dry up, it is harder for these stocks to keep up their charade, and they fall towards their underlying valuations. On a more fundamental level, we have seen some stocks fall hard this week. Stocks like $TUP or Tupperware Brands. We did some quick DD on these stocks, looking at their most recent SEC filings, and notice a trend. Some stocks are falling because their sales and gross profits are falling. Others are falling because their sales are falling, and cost of goods sold are rising, which puts double pressure on their business. If or when a recession hits due to fiscal and monetary policy shifts, and the potential war with Russia, and supply chain shocks, these and other related stocks will lose their profitability. We see stocks beginning to be priced levels that partially assume a recession. If one hits in the US, then stocks will fall to the valuations that assume 100% recession, and that means further falls. We have another index we like. Money manager and asset manager stocks. These companies (like us) make money if they manage more money, and if they successfully grow their assets under management. When times are good, they seem to print money, and pay healthy dividends. When times are bad, performance slips, pink slips sail, and investor money bails. In other words, money managers are a leading indicator on stock markets. We have watched money managers fall to levels of increasingly attractive levels and dividend yields, and think this is due to recessionary and asset bubble popping fears. It isn't just US Equities, but fixed income and real estate concerns as well. We also have a hypothesis that stock market returns are autoregressive. In other words, previous returns impact future returns directly. This happens when returns are greater than a certain percentage, as they impact liquidity and expectations of future returns. More to discuss. We find leptokurtic stocks that seem to be safer in this market. They are in that they fall less when markets fall, and rise less when markets rise. They deliver their mean results more often, and all results are closer to the mean. Today's results validated this hypothesis. Platokurtic stocks are fat tailed, and deliver a wider range of returns around their mean return. So, as Forest Gump said, "Life is like a box of chocolates, and you never know what you are gonna get." These stocks can go up and down dramatically around a mean. We further augment this group of stocks by picking those that have extraordinarily high price variance. Well, today validated this approach and these stocks had dramatic moves downward intra-day. What do we recommend you to do in this market? It depends on your objectives. If you are a gambler, then enjoy this period of higher and increasing volatility. Bet to the downside given current monetary policy shifts, supply chain challenges, and our current political leadership. You can buy and sell ETFs like $TNA $SQQQ $TQQQ $VIXY $UVXY and others. This is not a buy and hold strategy, and this is not for anyone that has to live on the money being invested. If you are an investor that must be in the market, I would stay with the tried and true value stock methodology. Find stocks that are trading well below book value and that have defensible and attractive economics and market positions. We found three of these for our own portfolio, and despite a 40.5% drawdown are holding strong. If you are an investor with a choice, I would stay out of the market for now. It is too early to buy the dip or call the top or bottom. The indices have not confirmed their reversal, and may still resume their upward run. I have coined a phrase for this market. FOMO is a cost effective strategy. It is not expensive to wait before you buy a downtrodden stock. It will likely be cheaper next week. Good luck to all this week. God bless you and your loved ones.
By: Jeffrey Cohen, Investment Advisor Representative, US Advanced Computing Infrastructure, Inc.
It's 2pm ET: The Fed decided to not roll over $47.5B of securities it owns in June, July and August.
Then, in September, October and November, it will withdraw (or not roll over) $95B per month. It will continue to reduce the size of its assets until: "Over time, the Committee intends to maintain securities holdings in amounts needed to implement monetary policy efficiently and effectively in its ample reserves regime." Plans to reduce the size of the Federal Reserve's balance sheet It is raising interest rates now to about 1% (or slightly less), then will continue to raise them. We heard Chair Powell say 3 x 0.50% interest rate hikes (next 3 meetings). So, this takes us to 2.5%. To us, this is neither bullish nor bearish. It is a 7-iron shot down the center of the fairway on a par 3. You don't swing for the green, and a chance for a 2. You lay it up nice and easy, guarantee yourself a 3 or 4, and eliminate the risk of missing the green entirely and ending up way over par. We are forecasting (so dangerous) a year-end interest rate of 2.5%, and a total quantitative tightening (or reduction in total assets held by the Fed) of $1T by year-end. This gets us to pre-COVID levels. Today's Fed action is consistent with that forecast.
It's noon CT and the FOMC press conference and press release are a few hours away. I wanted to share something insightful from the top of the FINVIZ homepage. It opened my eyes, and want to share with you.
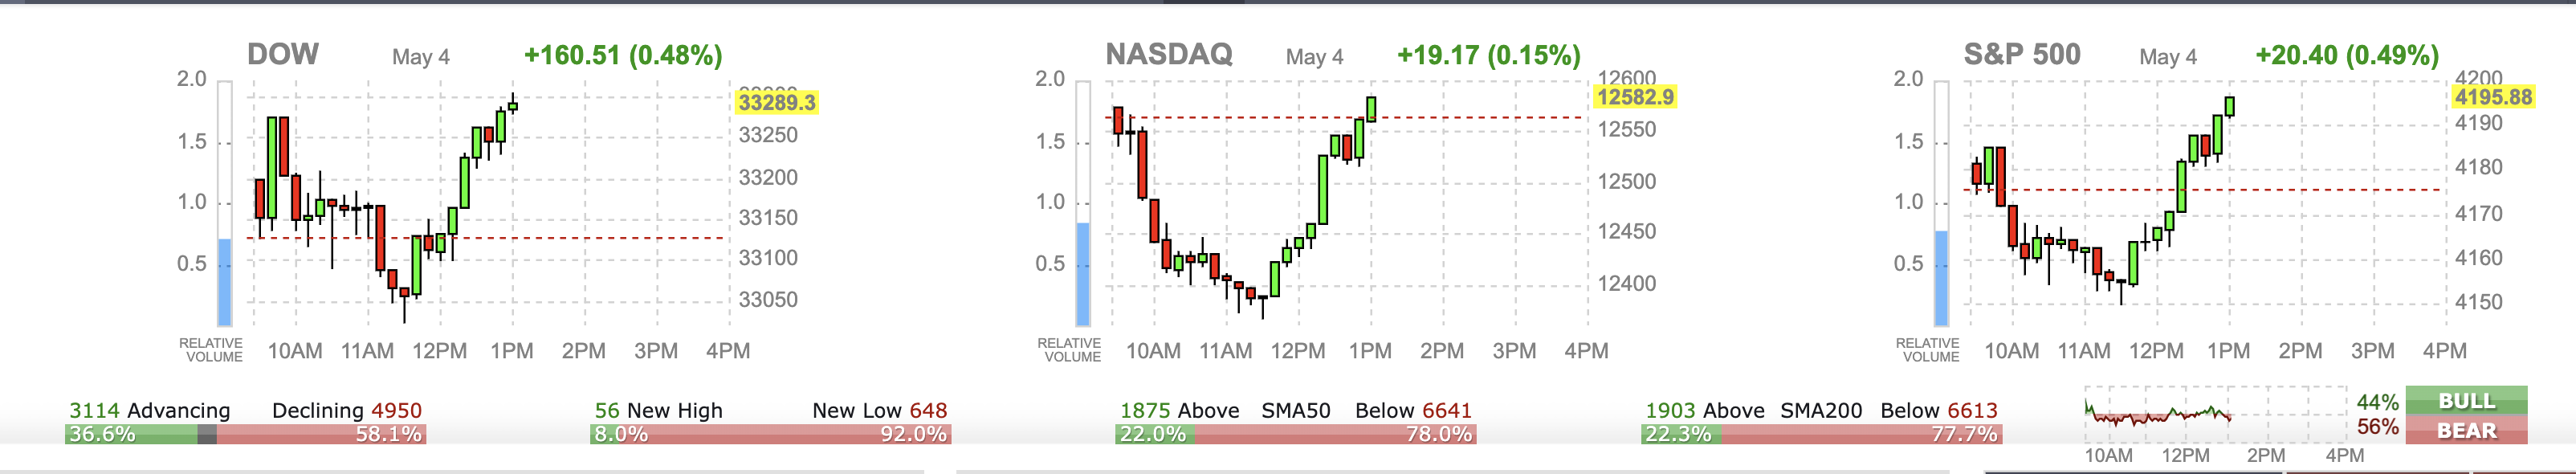
You can see the market went up, then down, then up. These are pretty big swings today, around 1.0 to 1.5% down, then up ~1.5%. Our intuition is that big money is betting in derivatives, options, futures and ETF that bet on the direction of the three major US indices, the S&P 500, the NASDAQ Composite 100 and the Russell 2000.
It is the five little bars below the indices that we noticed today. 1. 37% advancing vs. 58% declining. This means more stocks fell today than rose, even when the indices are up. This indicates that individual stocks are not broadly participating in the rise. They might by the end of the day if the indices stay higher, because money has to be invested from passive funds, but then again the indices could fall as 'whales' unwind their bets for the day. 2. 8% new highs vs. 92% new lows. Stocks that are falling continue to fall. FOMO is a cost effective strategy in downtrodden stocks, it is ok to have fear, but to save your cash. Very few new highs or stocks climbing. 3. Above or below SMA50. What is SMA50? It is the simple moving average of the stock price over the past 50 trading days. We use 253 trading days in our model, and compare stocks against their 253 day SMA. So, 50 trading days is ~ 2.5 months, and it shows whether a stock has been rising or falling during that time. So, we see 22% of stocks are above their SMA50 and 78% are below it. This means that for every 100 stocks you might own, it is likely that over the past 2.5 months 78 have fallen in price. 4. Above or below SMA200. What is SMA200? It is the simple moving average of the stock price over the past 200 trading days. This is ~ 10 months of trading, and is a long time to track momentum. In this case, the answer is the same, with 22% of stocks above and 78% stocks below their 200 day moving average. This is probably a good indicator of whether retail or typical investors made money on their stocks, as they may hold stocks about a year. 5. Bullish or Bearish sentiment at that moment. This is running between 44% bullish and 56% bearish. Who can blame the bearish ones, when 78% of their stocks are below where they bought them. Hope you found this educational. Please check out the Finviz homepage often to keep up with these metrics. They represent market breadth, or how wide the gains or losses are in the market. Today, there is very little breadth present, as the indices are rising, but leaving most stocks behind. The little
We ran our models and looked at the pre-market action. Market is mixed and not finding confirmation either way (up or down). As a result, Fear Of Missing Out is a prudent strategy for downtrodden stocks.
In our opinion, a stock that is now down 50% will likely be down further in a week or two. It is prudent to wait. In terms of our overall picks, here is the tweet that says it all.
Evening Update: FOMC Prediction
We posted our FOMC Prediction on rates, total assets & one more thing on Twitter tonight.
We covered so much ground this morning. You should watch the video. We enabled CC (automatic).
By Jeffrey Cohen, Investment Advisor Representative May 2, 2022: Pre-market A few key take aways: 1. A few stonks / meme stocks are on the rise in pre-market. Bets are being made. Buyer beware $GGE Green Giant $MILE Metromile, $BBIG Vinco Ventures, $LGVN Longeveron, $MMAT Meta Materials, $FATH Fathon Digital Manufacturing Corporation, $AARQ Arqit Quantum and $EAR Eargo. Finally $AMTI Applied Molecular Transport. 2. The US equities markets were trading lower in pre-market. It looked like a very red open, very down. However, by the time the market opened the markets were flat. The RED movement pre-market was a head-fake. Nobody knows what will happen today, and this 'signaling' reminds me of tit-for-tat signaling or auction signaling studies we did in my PhD program. Read the signals, but don't take pre-market or after hours trading as gospel. 3. There were many bearish signs, and many bullish signs in the pre-market markets today: Bearish: US Dollar up strongly, Bitcoin and crypto staging a rally, US Treasury interest rates moderating under 3%. Bullish: People on Twitter were bearish. Stocks like $VZ Verizon Communications were up in pre-market. People were putting money to work, quietly, to earn a 5.5% dividend yield. Trucking index is higher, and most of our indices (money managers, efficient stocks, cannabis, crypto and miners) were mixed, with stocks up and down. 4. Technology growth stocks are getting less expensive. They are rising up very high on our 'smart volatility' CQNS UP Run. Especially the largest ones like $NVDA Nvidia, $QQQ The Nasdaq Composite 100 Index ETF, $MSFT Microsoft, $GOOG Alphabet, $AAPL Apple, and $AVGO Broadcom. These are showing up as being better investments from an efficiency perspective than most other sectors. 5. Returns in the market (exc. dividends) are all negative (vs. average close price for the past year) Riskfree rate = 1.00% Actual SPY return = -0.63% Use floor S&P500 rate = 5.00% Actual IWM return = -18.26% Use floor Russell 2000 rate = 5.00% Actual QQQ return = -7.49% Use floor NASDAQ 100 rate = 5.00% =========================================== Market return = 4.00% Good luck to everyone out there. We do not have a bet or side in today's market except we are long three stocks (bagholding and waiting): $CRBP Corbus Pharmaceuticals, $AMS American Shared Hospital Services, and $SMLP Summit Midstream Limited Partners. We are glad to wait with these three names. We are very bullish on these for the longer-term. Might take a while for them to rise. This is not investment advice. Thanks to a VC friend of ours on Twitter, @MargaryanNerses, from himkcapital.com, we added $TNA to our run on Sunday (today). This is a 3x bullish small-cap stock derivative.
It is a very efficient investment, giving significant expected return with minimal historical price variance. $TNA is smart volatility if you want to make a directional bet. |
Stock Market BLOGJeffrey CohenPresident and Investment Advisor Representative Archives
April 2024
|
||
 RSS Feed