|
Here are the 10 stocks with smallest volume vs. last year's average volume. They did not trade very much yesterday, under 10% of last year's average daily volume.
0 HUSA Houston American Energy Corp 2.5% 1 TRHC Tabula Rasa HealthCare Inc 3.0% 2 LGVN Longeveron Inc 3.4% 3 SST System1 Inc 5.2% 4 TXMD TherapeuticsMD Inc 5.7% 5 IVVD Invivyd Inc 6.2% 6 CVM Cel-Sci Corp. 7.6% 7 CASA Casa Systems Inc 7.9% 8 USEG U.S. Energy Corp. 8.8% 9 ADN Advent Technologies Holdings Inc 9.6%
0 Comments
Good morning. Our model is up to 34 stocks held evenly in the optimized CQNS Long portfolio. This portfolio would be hedged by shorting the $SPY by a BETA-weighted amount.
The benefits of stock picking declines when short-term interest rates approach the expected return of stocks. We only see four stocks with a better risk-adjusted return than the indices: 2 PNM PNM Resources In -0.000044 5.23% 0.60 1.06 0.00113 1.04 0.20 4 IEP Icahn Enterprises L P -0.000020 5.66% 0.79 1.10 0.00243 1.16 0.30 5 BRK.B Berkshire Hathaway Inc. -0.000019 6.89% 0.77 1.01 0.00560 1.00 0.77 6 AME Ametek Inc -0.000007 7.17% 0.69 1.13 0.00684 1.01 0.86 All of these stocks pay a dividend. That helps in a risk-off market. Good luck in the markets today. Stay safe. We realize that factors that describe stocks, like BETA values, and kurtosis which are calculated over the past year are changing quite a bit between January 12, 2023 and February 6, 2023.
We maintain US listed stock portfolios of these types of factors. More than half the stocks in each list are different over the past month. This means that edges provided by mathematical anomalies from normal distributions may not last more than a month, on average. Today's 31 stocks are quite different than the stocks selected yesterday. One notable difference is that Google is out and Facebook (or META) is in.
The reason that the market is risk-off is that the expected return is not that much larger (~3x) than the cost of the risk of portfolio variance. So, don't go 'all in' on a few stocks and hold a diversified portfolio. Our 31 stock portfolio contains gold $AAAU and US Treasury Bond ETFs $SHY and $TLT. Good luck in the markets today. Here are our picks for a long portfolio, starting at market open today. ['AAAU', 'ACI', 'ATVI', 'CFFN', 'CME', 'ELME', 'EWCZ', 'FROG', 'GEN', 'IEP', 'INST', 'JNJ', 'K', 'LHCG', 'LMT', 'LOCO', 'MCD', 'META', 'MGI', 'PCAR', 'PEBO', 'PFSW', 'PNM', 'QCOM', 'SHY', 'SPH', 'SPOK', 'TGNA', 'TLT', 'TXN', 'ZGN'] 31 We will track these starting today for 20 trading days. We explain in detail what that means and why we believe that US Equities are heading for a period of time when investors should increase their diversification and reduce their most risky positions. We completed our corporate taxes last night and submitted them.
A few thoughts: Our IT and market data costs have grown, and continue to be significant. The process of being licensed by FINRA and being a member of QED-C is also a relevant cost to our business. Finally, we are operating with very limited labor costs. As we grow, this will become our dominant cost category. Overall, we have mostly fixed costs in our business. Therefore, growth in client orders generates positive net income and operating leverage. Don't trust negative BETA stocks to move opposite the US stock market all the time. Today, all of the US common stocks with a negative BETA that we found a little while ago are moving with the US stock market. The synthetic ETFs with synthetic negative BETA are moving against the markets, but that is because they are designed to do that. All of the negative BETA stocks are lower with the markets today. 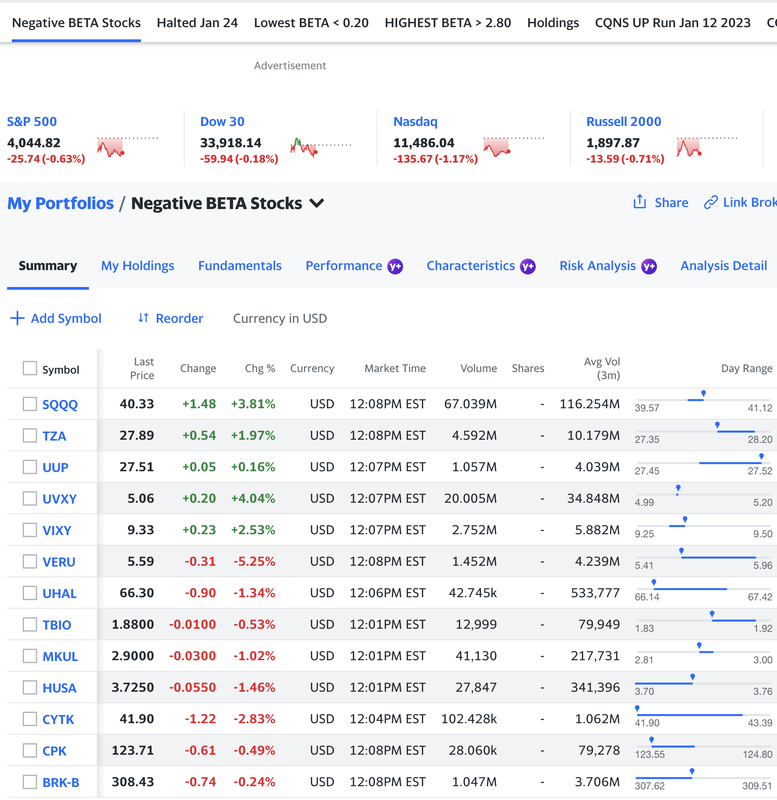 Here is our morning, premarket video on global stock and bond markets. Jeffrey Cohen US Advanced Computing Infrastructure, Inc. We notice a few things in the market this morning before the open. We did our review about 45 minutes before market open (and into the open) on Monday. The US equity indices were all down. Small caps were down more. US equity indices are all up lately...up about 10%, so this can be considered chop. In fact, if the S&P 500 can rise to 4200, they break the lower high trend of this bear market. We are facing consolidation and resistance to continued increases. US Treasury Bonds are very high these days, close to the peak. This means that long-term interest rates (US Notes and US Bonds) are falling. Not that they are as low as they were a year ago, but they are lower than they were a few months ago. Overall, we see signals into the future macroeconomic situation: Copper prices are up ~20% from where we remember it recently. This is a China reopening trade, and a manufacturing bet. Copper goes up with manufacturing goes up. It is also likely an inflation trade. Silver is up too. Like Copper, Silver has industrial and commercial uses, in addition to being a precious metal. This is likely also a China reopening and no-recession trade. The US Dollar is down 10% from where we recently tracked it. That is a big move, and means either the rest of the world is raising interest rates, or the US will not go through with its inflation fight. The world does now want US Dollars, nor the safety of US investments. Ten percent decline in the US Dollar is a big drop, although admittedly it had risen significantly before this recent fall (Euro/Dollar was under 1.0). This feels like a consolidation in the US Dollar. Gasoline prices are rising, but more importantly end-user gasoline prices are rising. We see this in Illinois, and worry that taxes may have increased, along with refining, transportation, and marketing costs. The international market was mixed last night. Hong Kong and South Korea were down, along with Europe. However, mainland China was up, and the rest of the markets were mixed. The Hang Seng may just be a small consolidation of recent gains. Slight consolidations. Same with the Kospi (South Korea). Equities are up over the past six months. Markets are up. In the US, the S&P 500 is up significantly and today could be a slight consolidation. The market bottomed at ~3600, and is now up to ~4100. This is just chop in our opinion. $CRBP or Corbus Pharmaceuticals is not looking up this morning. It is our worst nightmare, and is down 85% from where we started buying it. We are still very bullish on Corbus, and are afraid we might be the only bulls in this stock. We are long Corbus Pharmaceuticals common stock. We also reviewed these groups of stocks all in pre-market: Negative BETA High BETA Low BETA Leptokurtic Platykurtic Negative SKEW Positive SKEW Semiconductors Quantum Computing and quantum security pure-plays Transportation Cannabis Steel and mining The market looked very negative and not RISK ON this morning. It looked down with little regard to risk. Good luck in the markets today. Jeffrey Cohen
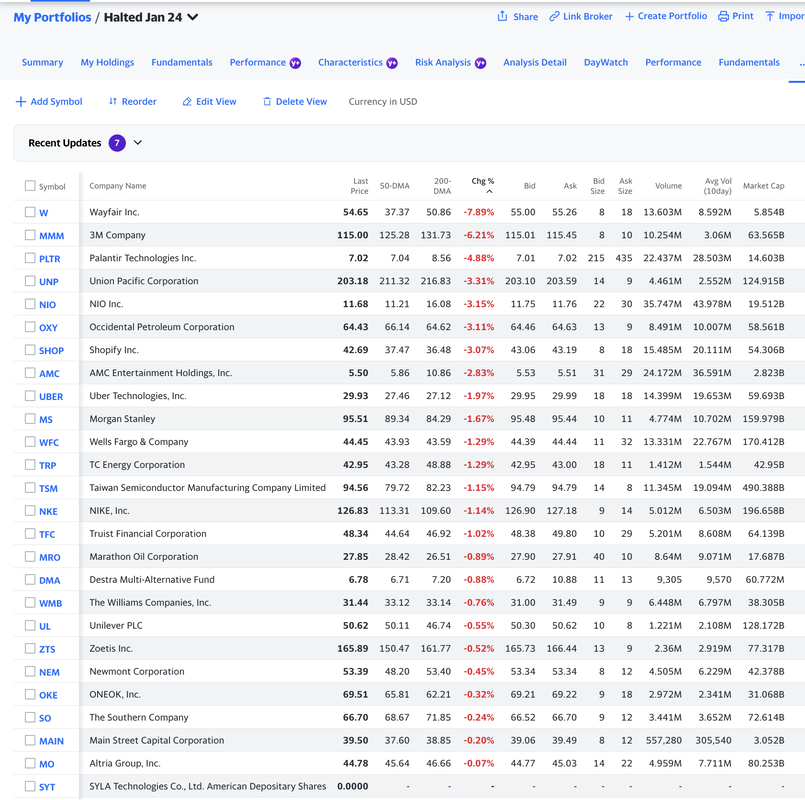
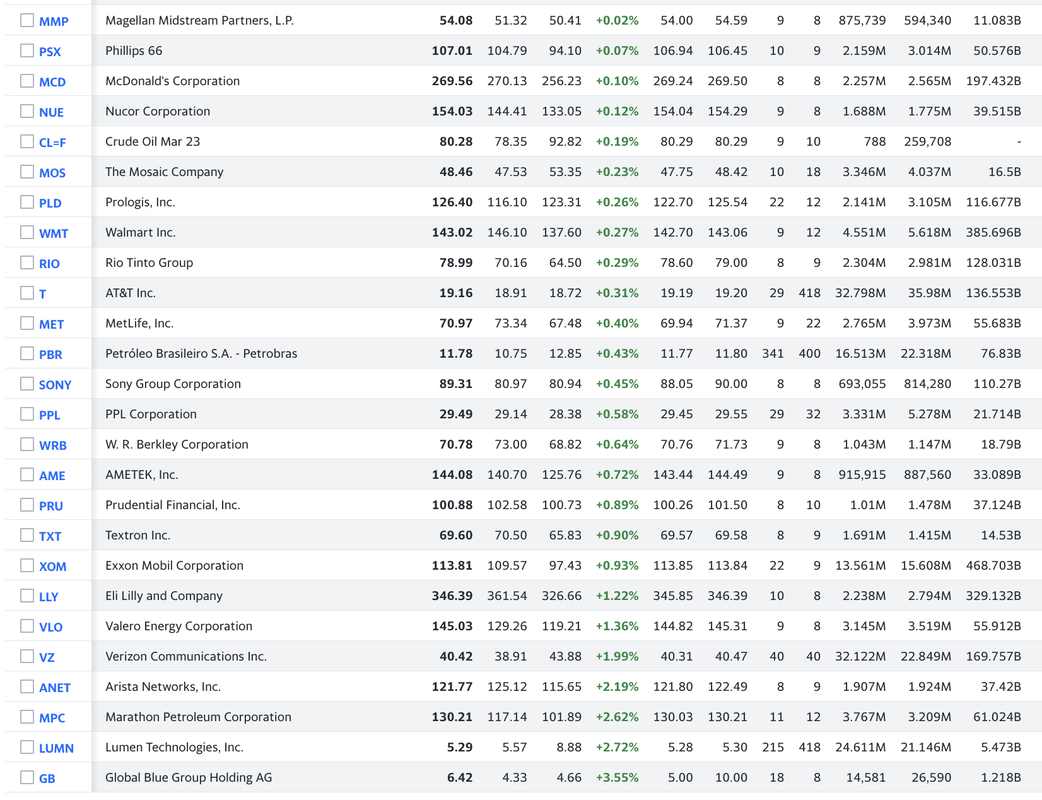
We were getting ready to make a video and do whatever it is we do at market open when BOOM all of a sudden the market falls dramatically. Twitter lights up. Stocks in the S&P 500 are halting. These are not small capitalization, MEME stocks, but big stocks worth billions or hundreds of billions of dollars in equity market capitalization. Stocks like $MCD, $VZ and $MMM. Some had earnings today.
We thought that this was terrible. It was a sign of market instability. Flash crashes are not helpful, and if they last for more than a few minutes they could trigger significant market instability through margin selling and forced unwinding of positions due to Value At Risk and Compliance issues. We tweeted something positive and life affirming, think it was the Kool Aid character and a statement that we were bullish, because we did not want to contribute to a possible crash. Not our style at all.
By the end of the day the market recovered. Not just that, but the stocks that sold off the hardest also recovered. In fact, they hardly moved at all and were flat on the day, along with the $ES_F which was down only -0.07%.
Here was a tweet of an analysis we did after the market closed:
In the end, this was a non-event.
In my opinion, based on my active imagination and some anonymous twitter vibes, I think what happened is that some options activity which required hedging by selling the underlying S&P 500 stocks happened. It happened in error, and there was the equivalent of a fat finger mistake (or just adding a few zeros to the position sizes). In other words, some trading desk made a mistake and sold liquid, highly capitalized stocks to hedge an options or derivative bet. The NYSE and NASDAQ exchanges figured it out quickly, halted trading, and the janitorial crew came in and put Humpty Dumpty back together again. There was "nothing to see here" by the end of the day and the halted stocks (the few that we read about on Twitter) were equally up and down and the median move was ~ equal to the overall change in the index. Nothing to see here, but wow will I be careful about putting in out of the money buy orders unless I really want those shares. Good luck tomorrow. Jeff By Jeffrey Cohen
US Advanced Computing Infrastructure, Inc. It looks like the entire market is falling today. The US equities market was trading higher in the morning, but economic news was negative. Now, we see long-duration bonds trading higher, and stocks falling. Gold is flat to down slightly. What is interesting is that up until the poor economic news from the US Commerce Department the highest-BETA stocks were trading higher. Now, everything is falling. Good luck in the markets. Looks like we are easily maintaining our ~4,000 S&P 500 Index range for another few days. By Jeffrey Cohen, Investment Advisor Representative, Illinois US Advanced Computing Infrastructure, Inc. We saw a few articles today about Q4 earnings. People say they will be disappointing. People are worried that companies are not earning as much now as they did a year or two ago. Well, we have a different explanation for this concern over earnings. This has the potential to be a very long BLOGpost or a formal article, so we will just 'cut to the chase' and share our methodology and high level findings very casually. We look for time to write this up more formally. 1. We read the law. Here is the text of H.R. 5376, and we attach the file below. I think it says that any firm that has $100M in profit on average over the past three years has to pay it (tax is on net income, as stated in financial statements, not tax accounting). It also applies to any company that earns $1B in any one year. It excludes sole proprietorships, REITS and other specialty investment firms. 2. We run our model and as part of it we produce a spreadsheet. It lists all firms that pass our data validation, and includes the firm's net income for the past year. One key data validation is that they are actively traded and another was they had to have an equity market capitalization of $100M or more. They also have to be US listed stocks, and we manually remove non-US companies that are US listed. Could be errors in the data provided by our premium market data services provider, and could be firms with positive net income > $100M that are worth less than $100M or don't trade very often. It also completely excludes privately held firms. 3. We removed stocks that have errors in their net income. We produce a value of '999,999,999' and then delete it. In total, there are 1,100 high liquid stocks that have $100M or more in net income this past year. 4. We sum (like in excel) the total net income of all the stocks with net income this year of $100M or more. The total earnings is $2.05 Trillion US Dollars. The total is huge, and I am surprised by the net income of US corporations. If the Q3 2022 US GDP is $25,723 Billion US Dollars (Source: FRED GDP here), then 8% of our US GDP is earned by large US corporations, and that amount will now be taxed with an AMT of 15%. 5. The Alternative Minimum Tax casts a wide net. Large, publicly traded US Corporations that are headquartered in the US report a net income of $2.05T, or 8% of our $25.7T economy. That seems reasonable. Their minimum tax will be $300B in 2023. We don't know how much they pay currently, so the incremental amount is up to $300B 6. Now, what did we miss with the $300B / year estimate? a. Any companies that are owned by multinational corporations. The law could be read to reach in and take 15% of all of their global income, but let's assume it is 15% of the total net income (absent transfer pricing shenanigans), of the US business. b. Any privately held business with $100M of net income or more. A simple estimate of foreign owned firms (e.g., Honda, Samsung) and privately held businesses (Maritz, Cargill, and private equity owned firms) could add ~30% (+/- 50%) to this total. So, we add 30% to the $300B estimate and we hit $390B in potential corporate tax raised. Finally, we know how much money the US Federal Government collects in Current Tax Receipts on Corporate Income. That amount is $340.6B per year. Source: FRED Taxes on corporate income, series B075RC1Q027SBEA found here. So, we know that current taxes are $340.6B and AMT taxes will be $390B. How to calculate the 'extra' tax revenue raised by the AMT? This is where it gets complicated. What do we know vs. what have we heard as rumors? Fact:
Rumor:
Intuitive Sense:
So, by way of an intuitive guess, I would say that firms will take a harder look at their net income reported by their business, and this could overall reduce net income reported by US corporation, although that amount of reduction may not be significant. Finally, we SWAG that the revenue raised by this Corporate AMT will be $200B / year in 2023, and is highly dependent on the top 50 most profitable corporations. If they take tax avoidance action, then the funds raised may be significantly lower.
We published this article on Medium.
https://medium.com/@chicagoquantum/up-to-200b-tax-increase-on-us-corporations-inflation-reduction-act-4f67d01d6514 By Jeffrey Cohen Investment Advisor Representative, US Advanced Computing Infrastructure, Inc. Data provided by Intrinio (and we apologize for any mistakes provided by our data provider) We discuss these stocks: $HOOD $RRGB $WBD $SAVE $RXT $RBLX $WIX $TRIP $INFA $BYND $UBER $BKR $FLR $CCL $DNUT $Z $BSGE $SABR $CHWY $WRBY $UAL $SPLK $SMG $PWP $GILT $XRX $PANW $AAL $BA $JBLU $UTZ $ZS $SPOT $ETSY $ADT $DNB $SASH $BAX $ALL $RILY $GE $AL $CAH $AES $RCI $YELL $KKR $ARES $DOCU $TTD $W $MARA This list of stocks of money losing US companies surprises us. There are large, aged, established companies that should be able to make a profit. Others are eCommerce companies and 'new economy' firms. Overall, we believe all of these firms should be able to make a profit. We discuss them all ad-hoc and on the fly. December 19: We discuss the stock market today, stock volatility, and the companies that lose money. We review a list of money loser companies that we are surprised to see on our #stockstoavoid and stockstoshort lists. These companies we highlight (3 hand written columns of stocks) are large, well known firms that should be profitable in our opinion. Probably yours too. We discuss the list of these stocks and what we think has gone wrong. Hope it helps you think about companies that lose money, and how they can do better. How we all can do better to find value and give value to others. BTW, we closed our bank stock short on Friday. Finally, we discuss Chicago Quantum's analytical services and investment advisory services and how client can work with us. We have a holiday sale, and have discounted our one-time CQNS Up and Down runs to $100 apiece. We are discounting our primary service to a nominal amount to give you, our listeners, a chance to experience the model and data and to see how it works for you. We want more people to try it out, learn, and see what having a wide-spread market scan can do for you.
Our focus today is on interest rates and money supply. Money supply is very high, and has been coming down slightly (overall supply down $400B, excess reserves down $200B) and this impacts stocks negatively. Interest rates have risen, and continue to rise today. This is not a surprise to us, but could be to the market. Risky investments and 'bets' are less attractive when interest rates rise. We see that this morning. Stocks of US banks are down today. We are also amazed by the movement in Dollar Tree since they raised their prices from one dollar to one dollar and twenty five cents. Every item in the store, except for greeting cards, is now 25% more expensive. This has doubled the stock price due to the increase in profits. If a 25% raise doubles the share price. Why not raise it another $0.25 to 1.50? Why not two dollars? It sure seems 'too easy' for this company to be valued so much more highly from such as simple change. We also looked at other stocks in banking and they are down. We looked at stocks that have higher market capitalizations ($10 Bln and up, then $200Bln and up) and those are falling today. As a final thought, without giving any detail, we believe we see ($CS or Credit Suisse) the reason why the FED FOMC has so much trouble with Quantitative Tightening and removing excess liquidity and excess reserves from the banking system. We believe it is time for Chair Jay Powell to accelerate QT as much as possible, but also understand this could destroy our banking system and 'pop' the asset bubble even more than has been done so. Did I mention that the S&P 500 Index is trading above 4,000 again? Good luck in the markets today. We are absolutely bearish on a personal perspective, and our personal portfolio is net short. Our model portfolio from the CQNS / SV algorithms is always net zero long = short. However, we are less confident that the market has the ability to rise in the short term to make this model really profitable. We personally like a rising model better than a falling one, maybe because it seems more patriotic to have stocks go up (and profit), than to have stocks go down (and profit). Either way, the model has been doing well, but the feeling is different. Finally, the model does need orderly markets with sufficient liquidity and trading volumes to work. That is why we stopped our trading and went 100% cash about two weeks ago. Liquidity and volumes fell around Thanksgiving and we are waiting for them to come back. GLTA 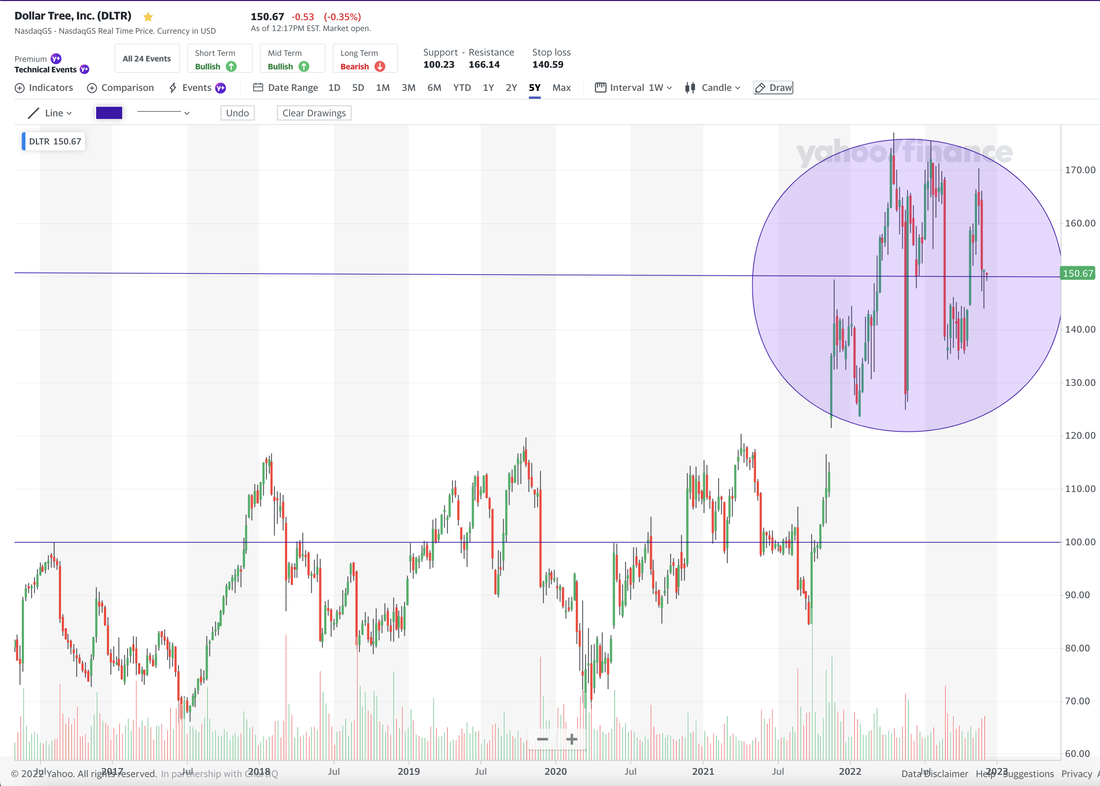 Jeffrey Cohen, US Advanced Computing Infrastructure, Inc Chicago Quantum (SM) What happened today? We made a video to discuss the core economic data we see today. It is all negative and recessionary for the US Consumer and US Manufacturer. Lots of bad news, and a little good news. Tiny good news. So, stocks are pretty strong today...flat...but US Treasury Bond Yields have crashed this afternoon. Good news: GDP grew in Q3/2022 by 2.9% (real) as a revision up from 2.6% (real). Forecasts call for a positive growth rate in Q4/2022. Chicago Business Barometer (TM) from ISM 37.2 (down significantly for 3 months in a row). Lots of bad news in the data for the Midwestern US. Inventory up, orders down, etc. Supplier deliveries down, new orders down, but prices paid are higher (not a joke). ADP Job Increase in November 127k jobs, except that the jobs were in the lowest rungs of the economy and job losses in manufacturing and professional / white collar jobs. Credit Suisse stock hitting an all time low (at least according to Yahoo Finance) and is down 95% from $60 to $3.00. We discuss some potential reasons why. We tweeted on this. Potential BK risk. Saudis and Qataris step in to help rescue the bank. 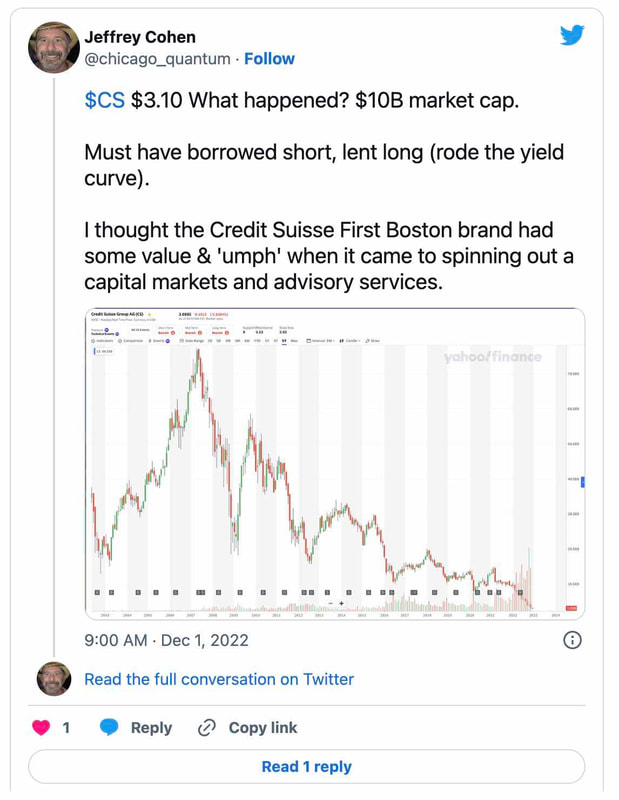 US Treasury General Account down about $500B this year. This completely offsets quantitative easing by the Federal Reserve Bank. Ouch! The US government collects taxes and this means they likely had to spend it. So, those taxes were not disinflationary after all! BEA: Personal Income and Outlays, October 2022 showed that the US consumer fell behind. It also shows that price inflation slowed slightly. Good news on prices, but bad news on the US consumer. Also, the US savings rate fell to 2.3%, which we believe is very, very low. This couples with retail feedback from companies that are reporting earnings and forward guidance. Costco, Dollar General, Dollar Tree and weeks ago Target are all saying the same thing. More shopping value priced goods. Consumers shopping to their budget, and focusing on core essentials. Also, profits from retail are falling as costs rise. So, it costs more to sell cheaper stuff to consumers who are borrowing money to buy it. Ugh, this is bad news. $COST $DG $DLTR $TGT looks at the news for the details (all from today except TGT). Dollar Tree mentioned they might need to lower prices (what, to back to $1.00?). We slowed down our shopping at Dollar Tree since they raised prices 25% earlier this year. Anecdotally, they tried to sell $3, $4 and $5 frozen food and that seems to have failed at least in our local store (freezers are now empty in those sections). Yesterday, Chair Powell of the Federal Reserve Bank gave a speech. Here is the transcript. We leave it to the actual words spoken, because we struggle to understand the intent behind the talk. It provides transparency, but may have been meant to guide the market and rates. Forward Guidance. Does not seem right that a speech should move markets. Maybe they should stop speaking to the press and public except during FOMC press releases? So much news... Earlier in November the Federal Reserve FOMC released its meeting minutes. We have been reading them and the data on the economy seems to show slowing and weakness. We found it to be very down and negative on economic growth in the USA, and led us to think a recession might be in store for us. This is the data the Fed FOMC had when they raised rates 0.75% last month. So, what are we doing? We have our managed accounts model portfolio in 100% cash right now as the market looks for direction. We are looking into Credit Suisse $CS to see if this could be a bargain purchase (or a short to zero and BK). This could be a waste of time on due diligence, but probably good learning either way. 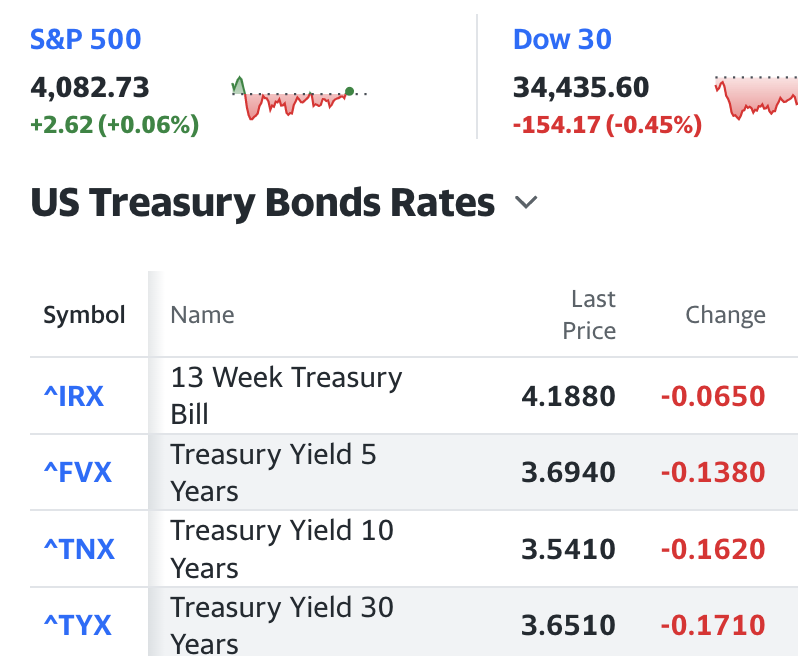 What about interest rates? We see significant interest rate / yield drops today across the yield curve. 10-year UST down 16.2 basis points. This is a significant move lower.
It appears we had another good day with our CQNS model. Last night when it ran, the aggressive RISK-OFF stance of the weekend moderated. Number of stocks dropped to 20, and the stocks were more back to normal with some technology and higher BETA names. The market did trade a bit erratic today, but it ended flat. The model picks were slightly red, but so was the S&P 500, so the hedge would have paid for some of the CQNS long declines. Net-net, the model suggested a less aggressive stance, and the market was pretty subdued. Makes us feel good about the predictive power. And tomorrow...We are starting off 'on the wrong foot' tomorrow.
1. The 13-week US Treasury yield is up to 4.25%. This requires us to adjust a key parameter in our model, the risk-free rate. It is only 5 basis points, but we like to stay a little ahead so may raise it 10 basis points. This will reduce the edge of stocks, and create a new RISK-OFF cycle. The question will be whether other rates rise in the short term, and whether risk-free hits 4.5% (which will be material for our model). 2. Stocks we follow have lower volumes being traded. This can reinforce trends and allow for over-sized movements in stocks which do have volume. The lack of volume can also be a good thing, and dampen down volatility, if the market is not also seeing low liquidity. A lack of both liquidity and volume could mean trouble, like a small helicopter flying too high and running out of oxygen (which causes a lack of lift and power). 3. There is a speech by Chairman Powell on Wednesday. Those can be material to risk if he has a message to send. 4. We started to read the FED FOMC memo from early November. We read portions and they were dire. Lower market liquidity. Higher market volatility. Tightening Main Street Conditions. 5. Headline readings on US Real Estate were poor. On the other hand, Santa may be coming to town. You know that old chestnut, the Santa Clause rally that lifts stocks in December as loss harvesting is completed and people reload positions. By: Jeffrey Cohen, Investment Advisor Representative US Advanced Computing Infrastructure, Inc. November 27, 2022 We ran our model last week, but kept a low profile on investments. We focused on family and did not make a single trade (our personal portfolio remains intact and our hedged managed accounts are 100% cash).
What we found today: The expected return from 'risk' of the US Equity market is 4.8% over the next 12 months, including dividends. This compares to a risk-free rate of return of 4.2%. This is not a very large return as compared to the returns of 2021. These conditions require larger portfolios (at least 20 to 35 stocks held equally) to provide significant alpha over buying the SPY, QQQ or IWM and holding. It may not provide a significant advantage over a simple portfolio of SPY and SHY, and maybe 1 or 2 more stocks, which we are finding to be simple to manage and reasonably good results from our model. We have those portfolios identified. In short, this is why we are suggesting the market is RISK-OFF this week. A savvy investor looking to balance risk and return to find an edge has to work much harder, hold significantly more stocks, and take less risk. CQNS Down Run: The 809 stocks that passed data validation for our CQNS Down run (stocks to potentially avoid) have an all stock variance of 8.0 x 10⁻⁴, and this compares unfavorably to the S&P 500 Index ETF (SPY) variance of 2.3 x 10⁻⁴. Liquid stocks of unprofitable, US-listed companies (this group) have 3.5x the variance of the S&P 500 index ETF. There are many biotechnology firms at the 'top' of our CQNS Down stock list, at least half of the top 50. The others are downtrodden names, MEME stocks, and a few fresh new faces that we have not seen in the list, and are potentials for shorting, or at least avoiding. They have variance that outweighs their market-following direction, or BETA. The #1 stock to avoid is ALLK, and that stock can be put together with many other individual CQNS down stocks to provide a terrible risk-return trade-off portfolio of two stocks. These would be heavily biotech, but we see a few non-biotech MEME-like names to match up with ALLK. This run is interesting for having 30 stocks with a BETA of 2.50 or higher, and the highest BETA found is AFRM. These stocks will move with the markets, and are unprofitable, so likely 3.5x more risky than the market. Fasten your seat belts. There are three negative BETA stocks. These stock are moving in the opposite direction as the SPY. BRK.B Berkshire Hathaway Inc. -0.12 SPRY ARS Pharmaceuticals Inc -0.04 VERU Veru Inc -0.86 CQNS Up Run: The risk of this portfolio of 1,710 profitable stocks is 2.6 x 10⁻⁴, which compares favorably to the SPY with a variance of 2.3 x 10⁻⁴. The risk of holding a large, diversified portfolio is 1.13x the SPY, which is insignificant. We see a few anecdotal things in the data, as follows: 1. The 50 stocks with the smallest volume on Friday compared to last year have very small volumes, all at or below 14.1% of last year's volume. However, the 50 stocks with the largest volume traded at or above 81.7% of last year's volume. Four stocks traded above 205% of last year's average volume. 2. There are stocks that have gone up in price, and stocks that have gone down, also at relatively extremely level (down 3/4 or up 2x as compared to the average over the past year). So, there is movement in prices. 3. There are high and low BETA stocks, at the extreme ends of the spectrum (0.1 or below, and 2.5 and above). So, there are stocks that are moving at extreme levels of correlation (or even leverage) to the market, while others are largely independent of market moves. 4. The best 15 CQNS UP portfolios found are all within one tick of each other, and vary from 18 to 23 stocks. To retain 37% of the edge, you can hold a 7 stock portfolio that includes QQQ, SPY, SHY, and four individual common stocks. There are negative BETA stocks that were identified. These are not included in our run, and we present them to you for informational purposes. CPK Chesapeake Utilities Corp -0.646 SQQQ ProShares UltraPro Short QQQ -3x Shares -3.800 TZA Direxion Daily Small Cap Bear 3X Shares -3.259 UUP Invesco DB US Dollar Index Bullish Fund -0.185 UVXY ProShares Ultra VIX Short-Term Futures ETF 2x Shares -3.604 VIXY ProShares VIX Short-Term Futures ETF -2.443 Our previous managed accounts had around 12 stocks, so these are larger portfolios. Again, we call this a risk-off portfolio as we are further spreading out investments to gain the best edge we can, and that edge tends to be smaller along with the return from market risk. There is one more thing... We run our model now against two baselines. One is the SPY and the alternative is the QQQ. We do this to get a 2nd look or alternative view of the best portfolios. The answers are always different, and we do learn a great deal. What we learned today is that you can hold three stocks (ETFs actually) evenly, and hold 82% of the benefit of a fully-sized 34 stock portfolio. There are a few additional portfolios of four stocks that close to 80% of the alpha, and are surrounded by portfolios of ~100 stocks. This is important information if you want to beat the performance of the QQQ. The same results are not available to beat the SPY (our base case run is harder to beat this easily). Good luck to all. Jeff By Jeffrey Cohen US Advanced Computing Infrastructure, Inc. The consumer price index data came in this morning. It was lower by a tick, nothing more. All of a sudden, bond yields are crashing (10-year UST yield down 21.3bps). Stock index futures are up ~2%.  There is a lesson to be learned here, but we are not sure what it is.
Here are some thoughts: 1. Don't trade in a market like this, where liquidity is down and moves are aggressive. You will lose your 'alpha' or edge in transaction costs. The pre-market spread for two stocks we own is 7% and 30%. There are significant bets being made (likely by multiple trading desks and portfolio managers) in the same direction. Huge bets in pre-market on UST-10 year (long) and US equity indices (long). As a retail investor, you will likely pay more in transaction fees, and the moves are so great you may lose more than your money...but also your nerve. This is like riding a tsunami on a surfboard. 2.We are 'stuck' with our stock portfolio as-is, until markets settle down. We have 19 longs, 3 shorts, and have a short SPY position. One long and two hedges (to track performance). Our CQNS Long portfolio wanted us to go 'Risk On' this morning, but we are too late due to the pre-market moves already made. There are significant sells of low-beta stocks and significant buys of high-beta stocks. The ideal portfolio for the SPY-based run is 11 stocks, and the QQQ-based run is 14 stocks as compared to our current 19-stock portfolio. We will ride out the storm until liquidity returns. 3. We will try to make a few position changes this morning to take advantage of the rising stock prices. However, if we only sell and don't buy, we will be in a > 1.0 hedged position. We will report back our progress. Ok, markets open 90 minutes. We sold > 50% of our CQNS long positions, the ones that were not in our CQNS Long portfolios as they read today. Those tended to be some of the in/out tech stocks, and the main street low BETA stocks. Those are now liquidated. We also reduced our hedges by around 20%. This means we are over-hedged for a few days while we wait for a chance to buy into our new longs (maybe Monday). This is a risk, but seemed a shame to miss a chance to sell into strength. The markets are acting strange today. US Treasury bonds yields are down 20 to 33 basis points, depending on the duration. Stocks are up 3% to 6% depending on the index. Crypto has made a recovery today Copper is up significantly, and carrying forward a recovery rally (up to $3.77/oz). Silver is up to almost $22, and even crude oil now is green. The US Dollar is weaker. It was like everyone saw a ghost. Everyone turning bullish, globally. Belief in a FED FOMC pivot. Crazy, actually...and we don't buy into the narrative. So, our CQNS Smart Volatility model portfolio is under-invested this morning after taking gains, and over-hedged by stonks and the SPY. By Jeffrey Cohen
US Advanced Computing Infrastructure, Inc. Good morning! Today went from red to green in the US equity futures. The US Equity Futures are drifting back to a flat (to up) open. There is movement in our CQNS Long (or up) model portfolio this morning, as stocks prices (but not volume) look like they have done a day's trading...and all by 7:34am CT (or about an hour before market open). Pre-market for a few select industry groups:
The Vix is red (which means lower cost of protection), and bonds are trading this morning mixed and higher. Energy is down, and the US Dollar is weaker. Seems like a great setup for US equities to rise. However, while we were watching the Level 2 order book in Nasdaq (all exchanges) for $SPY, we saw a big trade go through. Nothing dramatic, but about 29,000 shares were sold in one order. This reminded me that there are forces moving the equity markets up, and there are opposite (but not quite equal) forces moving them down. Crypto, especially Bitcoin, has been range bound for months. BTC/USD is trading now at $20.8, which is around the $20k mark. Currencies are setting into a trading range as well, with the Euro at $0.9993, GBP at $1.1472. It takes 146.19 Japanese Yen to buy a US Dollar, and it takes 1.3468 Canadian Dollars to buy a US Dollar as well. In terms of overall market breadth, on Friday there were 67% advancers and 28% decliners, and ~ 3:1 new low to new high ratio (437 lows to 155 highs). For US Corporate Bonds, the the A/D ratio was similar, but there were many more new lows than highs. There were 5,024 advancers to 3,584 decliners, and there were 631 new lows and 38 new highs, for a ratio of (17:1). Good luck today. We are watching the markets whipsaw today. Interest rates are rising across part of the yield curve. Stocks are up, down, up, down all day. Made a video sharing transparency: https://youtu.be/FCFuD25wQZk |
Stock Market BLOGJeffrey CohenPresident and Investment Advisor Representative Archives
April 2024
|
||
 RSS Feed