|
We follow a set of tool makers and these stocks have not been doing well during this earnings season. The whole industry is showing weakness, a secular decline driven by housing and commercial construction weakness. Snap-On had a really bad week, as this stock recently was trading close to $300 (as in this week). We saw Techtronic Industries lower for days at a stretch, and it may not be because of the publicity issue. Stanley Black & Decker had a rally, but it pulled back. Chervon...same story. So, where are we? We are optimistic that patience will pay off in this sector and we are long. We might not see real secular improvement until the construction and residential markets pick up. 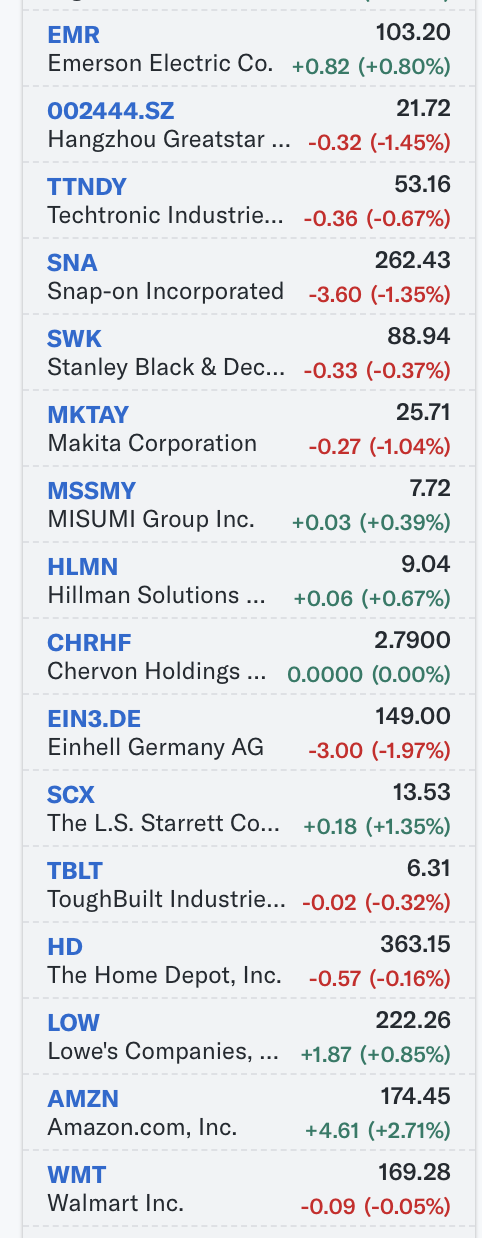
0 Comments
By Jeffrey Cohen
President, US Advanced Computing Infrastructure, Inc. Q: What do you need to see to cut rates? A: More good data. We are confident that inflation is coming down. More good data. Q: Nick Timeros, WSJ, what does 6 weeks or 3 months buy you? Why wait? A: Growth strong. And labor market strong. Really confident that inflation is at or below 2%. Median participant wrote down 3 rate cuts this year. We need some confirmation, sustainably to 2%. Gaining confidence. Sliding employment would also allow for cuts in interest rates. Cutting sooner if there was weakness in labor market conditions. Q: What about if we see stronger economic growth? A: Solid economic growth is welcome, desired, and as long as this is here, we don’t need to cut. Nobody (the voting members of the FOMC) wanted to cut rates. They were not considering a rate cut. Q: Are you looking at economic data like OpenTable reservations or indicators of activity? Which ones? A: It’s not the pandemic. People are working and are earning wages, so we can look at traditional data. We don’t need ‘innovative’ data. Q: Are interest rates restricting the economy? A: Supply side is growing quickly. More activity is driven by labor market healing and supply chain healing. When this peters out, you will see more restriction. In other words, we are not seeing interest rates being very restrictive. Overall, we are in a good position. The economy is doing ok. March is not the base case for cuts. My Thoughts at that time: Equity market is down at 3pm ET, maybe not such a good meeting. Q: What about balance sheet run-off? Changes to the balance sheet of the Fed? A: March meeting, that's the balance sheet meeting. They will look at that independent tool of runoff. Should they? It could happen that rates decline, but runoff stays or vice versa. Q: If not in March, when would we know? How many months? A: We have growing confidence on inflation. It is a very important decision to start cutting rates, it is consequential, and they want to get the job done right. Q: Change gears. Your name comes up, and what about a third term as Fed Chair? A: I am focused on doing my job, and this year is a very consequential year. Buckled down to do our jobs. ToughBuilt Industries Inc. $TBLT Company Analysis
We will be updating this webpage frequently with new information. If you have feedback, please let us know here in the comment section below. Jeffrey Cohen, US Advanced Computing Infrastructure, Inc.
We see interest rates rising in an aggressive and significant matter. We follow the US Treasury 10-year note, which is up to just under 4.16%, and the 30-year is over 4.33%. Interest rates rising has a few direct impacts (e.g., more expensive loans on consumer and business credit, secured loans, asset based lending), so business will slow. Mortgage rates will likely rise 100% with the 10-year UST Notes. The indirect impact is that the US Treasury will pay more to roll over its trillions of dollars in debt. However, on the flip side they will pay less if they want to buy back debt in open market transactions, and then the loss moves to banks, pension plans, and longer-term investors. What we see is home improvement, materials, and tools & accessories stocks are down. Check out $XLB. Momentum stocks are down sharply, these are your best 'sharpe ratio' stocks, which are falling with the overall US equity market. For an example, look at $TSLA. This is an equity decline and we are watching it happen. It is difficult to watch. Our recommendation is to look at longer-term debt (as a buyer) as we could see 5% yields on the US 10-year. That is an absolute buy point for us, unless things change. Boston Consulting Group BCG article that discusses our work. It’s Time for Financial Institutions to Place Their Quantum Bets OCTOBER 16, 2020 By Jean-François Bobier, Jean-Michel Binefa, Matt Langione, and Amit Kumar https://www.bcg.com/publications/2020/how-financial-institutions-can-utilize-quantum-computing Here is the link again, in a button format.
Good morning, been a while since I posted. Hope this is worth the wait.
1. Even safe stocks are mixed, with 10 of the 20 largest capitalization stocks higher. 2. Momentum stocks (a.k.a. new economy stocks) are lower, having fallen for the past week. This implies weakness in the future for our U.S. economy based on the movement of stock prices. 3. Interest rates are significantly higher. The 10-year is not only above 4%, but it is approaching 4.17%. The 10-year US Treasury Note traded at a high of 5% in 2023. This does make bonds less expensive, and it raises interest rates in the 'real' economy for things like residential and commercial real estate loans. The 5-year U.S. Treasury Note is trading at 4.08%, and also has a recent high of around 5%. This rate drives automobile loans. 4. Economic news has been a mix of good and bad. Bank earnings showed delinquencies and rising credit costs. This is a very bearish sign. There has also been announcements of business downsizing and layoffs. On the other side, U.S. inflation continues to moderate, the U.S. labor market continues to be strong, and U.S. retail sales have maintained their momentum and growth.
I sold some calls today. The buyer seems to have done a very professional job by shorting the underlying stock over ~40 minutes after buying the calls. They locked in a $0.05 / share profit if they take delivery, or they may make more if the stock falls below the strike price prior to Friday at options expiration.
The buyer is positioned to ride this position out until expiration.
We both still have the option (pun intended) to close out the position before expiration. If we do, I get to keep my shares. The call buyer would receive premium, then cover their short by buying back stock. I am writing this up because I have made the same trade three times in the past few days. The first two times I think the call buyer was either retail, or not professional. They held a naked call position, and bought back my calls at a very low price, right around market close. I even saw a comment in StockTwits that said something like 'darn it, my calls are getting killed.' This last time, the calls retained their value such that if I wanted to, I could buy a bunch of stock, sell more calls, and if they take delivery I lock in around $0.05 / share profit.
If you want to better understand this, please give me a call.
Maybe we could set up a consultation for $250 and I will walk you through the trade. I am not keeping this trade data stored on my systems, so I would show you where to find the data. Sunday night: Nov 5, 2023: Seemingly random thoughts about U.S. equities from our model run11/5/2023 Good evening.
I am Jeffrey Cohen, and after reviewing the model run for this weekend I see a few things that I would like to share about this market. Our money is tied up (voluntarily), so we are not investing on Monday morning, so we might as well share some insight. Maybe we attract a few new clients. If interested, just give us a call or email from the Home/Contacts page here. 1) Actual market volatility is a tiny bit higher tonight after falling for months. Could be a one-off. We hypothesize an inverse relationship between price change variance and stock prices. If this becomes a trend, then new investments will require a higher expected return (a.k.a. lower prices). 2) The same stocks keep showing up at the top of our Chicago Quantum Net Score. Lately, they seem to be extra correlated to the S&P 500 equity index ETF SPY. We see this in elevated BETA values. 3) Elevated BETA values are where it is at in our model run. Not all high-beta stocks make the cut (some score quite low and are shorts/sells), but pretty much all of the top 20 model picks have high BETA values (greater than 3.0). So, high BETA does not make a stock attractive, but all attractive stocks in our model have high BETA values. 4) We are asking ourselves if the movement at the top of our model is intentional. Are these stocks being slammed higher and lower with the SPY, but always with the closing price coming back up or down so the variance and 'price shock' is less than it could be. We see that with one of our holdings, $SKLZ Skillz Inc., which is also a top 5 Chicago Quantum Net Score stock. It goes up and down massively intra-day, but usually closes off the high and low of the day. 5) The Chicago Quantum Net Score model has informed most of our current portfolio, and it is doing quite well for us. In addition, the rest of the top CQNS long individual stocks are also quite active, and rise and fall with true conviction. There are moves in these names that bless the savvy day trader. 6) Not to name names, but we do see a new stock (eCommerce in a way) towards the top of our list. the price is quite low, but that does not mean it is inexpensive, only that it has a share price under $1.00. The stock is QRTEA Qurate Retail Inc., and is representative of what we are seeing at the top of our model. Lower market capitalization stocks with high (and often increasing) BETA values that have been moving with the market but with less volatility than other high BETA stocks. In conclusion, we see a tiny dark cloud on the horizon in increased actual price volatility, and we see a significant number of high risk stocks camping out in the list of 'best' CQNS long stocks. Buyer beware, and do your due diligence. GLTA! Our interpretation of statements made by Federal Reserve Bank Chairman Jerome Powell:
The Fed is not relying on private actions: Tighter financial conditions driven by private action would need to be persistent and material, and independent of Fed / global central bank actions. 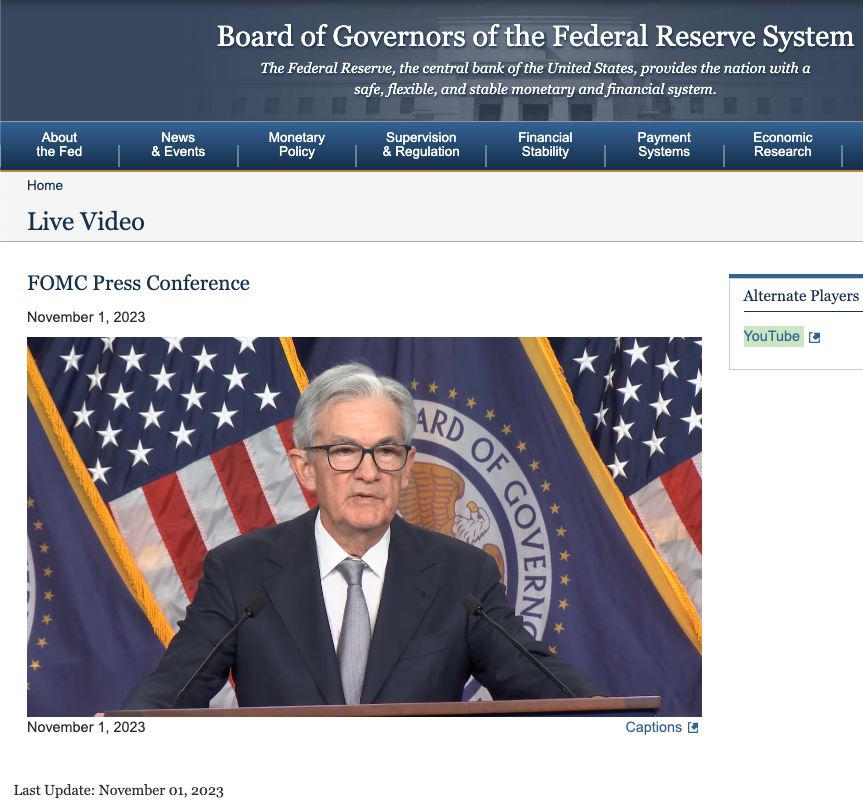 We wrote an article in Medium sharing all of the categories of U.S. economic personal consumption that declined in September 2023, from the previous month, on an annualized basis. The results will surprise you.
Here is the summary from that article: Our key take away from this lengthy list of goods and services that declined in the past month is that the U.S. consumer is cutting back where it can to save money. It is eating less animal products, consuming less recreation and entertainment, and letting their homes fall into disrepair. The U.S. consumer is gambling and playing less, giving less to charity, spending less on household and personal services (less personal grooming), and has slowed spending on new cars and trucks. We also noticed a big decline in video and audio streaming services (think Netflix and Spotify), and in the use of childcare and educational services. There are other goods and services categories in significant decline that continue to fall, such as landline phones, the use of stationary for writing, and television services. Of surprise to us was that electricity usage declined, along gasoline and fuel oils. Normally, this frees up spending capacity to be spent elsewhere. In our opinion, this is a sign of weakness in the U.S. economy. If you dig into the article, you will see certain line item of interest for stock investors. For example, haircuts are down, so European Wax Center is probably going to see declining revenues, and a falling stock price. Gambling revenue is down slightly, so there goes Las Vegas. Use the information as part of your investment research. Good luck. Stocks that we run in our model (subject to data validation) fell 2% yesterday, or $900,000,000,000.
$900 billion in lost market U.S. stock market capitalization. Bearish There are 14% fewer U.S. listed stocks (common stocks) than there were on May 5th (that pass data validation). Bearish Stock market 'actual or historic' volatility is down for the year. Down significantly, as in 40% or 50% on a comparable basis. VERY BULLISH The market at open (first 3 minutes) is rolling back yesterday's movements a little bit. We did elect a new U.S. House of Representatives Speaker of the House. Mike Johnson, Republican from Louisiana, a conservative and relatively new member of Congress. A breath of fresh air, and he passed with unanimous consent of Republicans. US GDP grew 4.9% in Q3. The U.S. economy is fine. Good morning. It is pre-market after a down day yesterday.
However, there are signs pointing to investors benefitting from a more RISK-OFF posture in the short term. Why? We saw a few Top Drivers yesterday, but it is about the stock price action sensed in our model. We will be making a video today as we pull the story together. Here are quick thoughts: 1. Expected return to risk is down as indices show smaller, or even negative YoY performance. 2. The lower expected returns, lead to smaller CQNS scores, which indicates either less confidence or less alpha or edge in the optimized long portfolios. 3. The S&P 500 Equity Index ETF, SPY, is our benchmark. It has started moving back up the charts, from around the 210th best individual stock to around 150 today. That is a big move, and indicates indexing and safety in turbulent times. 4. The rise of the small cap stocks at the top of our list. The top 50 stocks all have a market cap of $41B or less, and some significantly less (less than $100M). Yes, small caps have been a poor performer in the past year, with the Russell 2000 Index ETF down almost 4% this past year. However, the stocks at the top of the list have been falling and by definition, their valuations are lower. For example, Rackspace Technology, RXT, has a market valuation of $262M. Lower valuations make stocks look attractive by raising their expected returns, especially if and when their fundamental performance improves. On a personal note, we closed a key short in our portfolio two days ago, and regret that decision. To get back in today would require chasing a stock, as opposed to moving into a setup and waiting. We are not sure what we will do today in the markets. We have more work to do this morning. TTYL. Jeff
The U.S. stock market today was feeling blue (actually red) in pre-market. The key metrics people watch were all pointing to a down day.
The key metrics we tweeted about this morning were interest rates, the VIX, and the U.S. Dollar against major trading partners, and they were all significantly negative for stock prices.
It is now four hours after the markets opened, and the markets are positive and bullish on strong economic news about U.S. consumer spending.
We still see longer-term interest rates higher, such as the U.S. 10-year Treasury Note, up a significant 12 basis points and the rate is over 4.83%. Bitcoin is up again today, up over 1%, and maybe this is driving some of the market strength. Finally, on a refreshing note, the US stock market yesterday went up 1% (actual market cap of all stocks that pass our data validation), as did the U.S. equity indices. Those tied out in a very strong day yesterday. Today is more flat. This is an options expiration week for single stock options, so some of the action might be around those. Good luck to all. Stay safe. Tomorrow is trouble for U.S. Equities, even before we run our nightly quantitative analysis10/12/2023 We have been refining our 'top drivers of the U.S. stock market' list and spreadsheet. It is very much a work in process, we have two versions, and the data is delayed and not normalized.
However, it tells a story of lower asset prices, higher U.S. interest rates, a stronger U.S. Dollar, weaker U.S. consumers, and fear. Unless something happens, all the 'supporting data' suggests downward pressure on U.S. equities. Good luck to all. Good morning U.S. stock market enthusiasts!
The historic volatility for all of the stocks that made it into our model rose yesterday for the first time in quite a while. It is a small, typical sized daily change (not an amplitude anomaly, but a directional anomaly). What does that mean technically? It means that yesterday, and for the past year, stocks had more price movement. They have a higher variance in daily price changes. What does that mean for investors? It depends if this signals a new trend of rising volatility. If we see higher variance, then we see more risk and lower expected stock market returns for the next year. Hell hath no fury like unanticipated change. If variance is at a new level and starts to rise and fall, then we wait and see. It takes coal off the fire of new risky stock demand. If variance starts to rise and yesterday's reading is the low point, or trough of the variance readings, then avoid risky stocks. You can put money into risk-free assets earning 5% or more, or start looking at profitable, low risk stocks. Maybe this is when low-variance stocks might have an edge (we publish those too). An analogy for price variance hitting a trough...it is like when the Fed FOMC stops lowering interest rates and raises them for the first time. It is a tipping point in the market. We will continue to report on this. Jeffrey Cohen Highland Park, Illinois Registered Investment Advisor This is not investment advice. jeffrey@quantum-usaci.com +1.312.515.7333 By Jeffrey Cohen We are changing the way we think about future expected returns. This is currently a mechanistic way to calculate expected returns to risk assets based on academically rigorous methods dating as far back as the 1950s. Today, we are working on some new ideas. We start with the idea, mock up a spreadsheet, then figure out how to codify it into our model automatically. We are also looking at a pair of significant modification: - what data should we be gathering and outputting on each stock? - should we market capitalization weight the model? If you would like to get involved in our efforts, we will 'return the favor' by providing you with one or a few CQNS daily runs. Best way to reach out is phone or email on the 'home' page of this website, or via Twitter direct message, here. We produced a livestream youtube video of the company and stock Skillz $SKLZ. Hope you enjoy it and find it insightful. Towards the end of the video we document our key findings in 15 points: Skillz: Top 10 list: 1. The stock losses over the past month appear to be from low-volume selling, and not really from trading. The day’s lows don’t recover. IMO: this is just selling. Could be just shorting too? 2. The company trades at 1/3 of the book value. $84M equity market capitalization vs. ~$250M book value. 3. CEO made a statement about Q2 2023 objectives, and we are on track to achieve them. There is evidence. 4. More new games. Bolero, NFL, and others. Not that many reviews per game. Could new games mean more revenue. 5. AARKI (consulting firm) is getting new investment and 20% shares in their performance plan. Should help rebuild that business, which is helping developers navigate the new Google Privacy Sandbox method. 6. This stock keeps falling, down from $250/share to $4/share since December 2021. 7. A lot of short interest, maybe up to 2M shares out of 17.0M shares not owned by the CEO. 8. In the past few days, there has been significant short selling (short volume > 50% for the past 10 days). 74% and 62% in the past 2 days (very short). 9. In Stocktwits, this symbol has extreme fear (bearish) and extremely high message volume (loud). 10. (New feature) Daily challenges in a game does boost engagement. We know this from Monster Hunter Now. SSO, Enhanced Chat and other features are needed too. Integrated with Unity Engine. 11. We just bought 1000 shares: 12:44:41 $3.9894 on the video. It did not move the stock price at all. 12. There seems to be only one institutional investor: Wildcat Capital Management, LLC with ~19.5M shares (although they recently sold ~2M). Also, CEO owns about 4M of the 21M shares (and 100% of the Class B with extra voting rights). ARK and BlackRock used to own it, but not any more. Some small ETFs own it. 13. SKILLZ has many job openings in Las Vegas. Many leadership roles in engineering, accounting, operations and product development. 32 in Vegas, 15 in SFO, and 4 technical roles in Seattle. 14. Good cash management: Prudent stewards of capital. Jason Roswig, President and CFO, added, “Our prudent management of the business resulted in a quarterly cash burn rate in Q2 of approximately $14.6 million with our June 30 cash position (including marketable securities) of approximately $361.4 million. As a result, we have the flexibility to invest in new product features for our platform that will drive increased scale in our business and attractive top-line and cash flow growth. At the same time, our solid balance sheet and capital structure provides us with significant optionality to deploy resources to enhance shareholder value. In this regard, during the second quarter, we opportunistically re-purchased $159.8 million in outstanding debt at a discount resulting in total debt as of June 30, 2023 of $129.7 million.” 15. User Acquisition Spend (marketing) is getting more effective. They are targeting a 6-month payback period, down from ~11 months today (Q2 earnings call). We also made notable progress throughout the second quarter in continuing to improve user acquisition spend and are confident we are on track towards achieving our optimized goal of a six-month payback period.” One of the fundamental tenets of our Chicago Quantum Net Score model, and our portfolio management and investment theory, is that investors prefer less risk.
Investors see risk (historical or expected price volatility) as a cost of holding an asset. This is similar to the cost of interest rates you could earn if you invested in risk-free assets. Investors are willing to trade expected future returns to reduce risk. We see this in the higher valuations for companies that earn a profit, and especially those which also have low/no debt leverage. So, when we see stock price volatility continuing to fall in our equally weighted portfolios, we think that the demand for U.S. equities has a quiet support. This may be why stocks have not fallen further, or it could support a next price movement higher. Our run from last night, using data for one year through October 4, 2023, shows that price volatility is down again, and continues to fall. Last week we watched the large-cap stocks sell off. They recovered yesterday (as evidenced by strength in $QQQ), but today they are selling off again.
To be specific, if we only look at +/- 5% today stocks, above $10B in market capitalization (thank you Finviz), then we see the large growth stocks (e.g., tech) are down, and the more conservative stocks (e.g., pharma) are up. Large stocks have liquidity to enable large positions to change without significant price distortion, so we would look to them first for money flow estimates. The one stand-out exception is $NVDA which is up 0.7% today. As we step back, the market is showing choppiness (up and down with little direction). A little more down than up, which is understandable since interest rates are rising (and this lowers equity valuations). We look to the large capitalization stocks to assess money flow on a daily basis. One of our proprietary metrics is to look at total U.S. listed stock market capitalization for the stocks that pass our data validation. Tuesday's market fell and Wednesday's market rose, and anecdotally we saw this initially in the large cap stocks. At some point when the valuations move enough, we would expect to see a wealth effect. Current equity valuations are around $50T (+/- $5T). What does this mean for you? Let me know in the comment section below. In case you were wondering, yesterday was a significant recovery in stock market valuations.
We noticed the large-cap stocks were broadly higher, especially in the most risky parts of the economy. The fluctuations in stock market valuations are up the past two days ($1.7T and $1.3T). Buckle up. We don't think this is good for equities in the near-term. |
Stock Market BLOGJeffrey CohenPresident and Investment Advisor Representative Archives
May 2024
|
 RSS Feed