Top Dividend Stocks (Market Close, November 14, 2023)
When we find a top dividend stock, it meets the following five criteria.
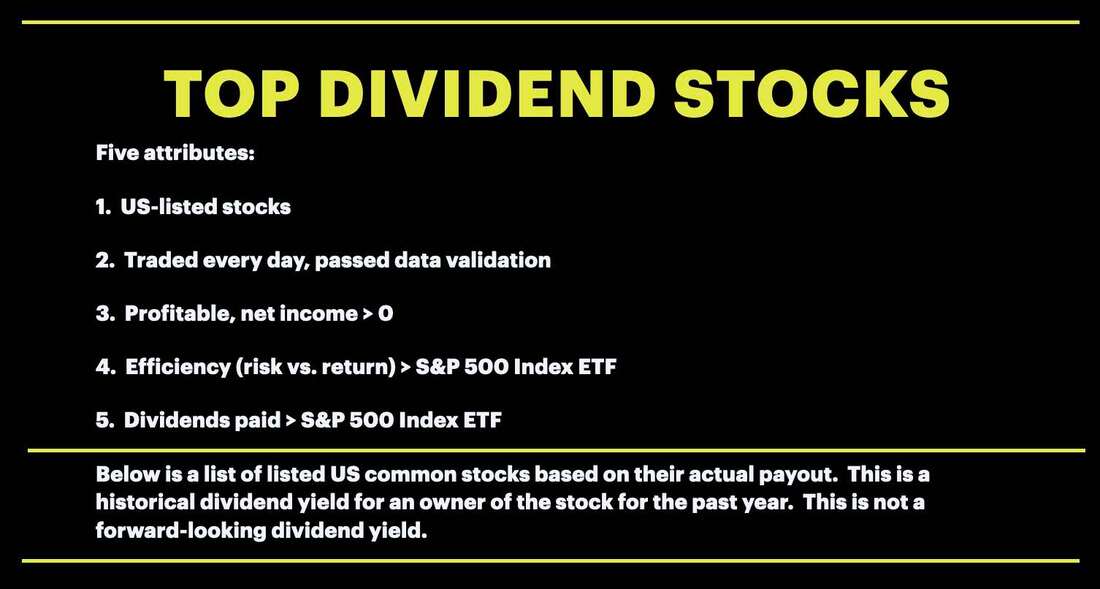
1. US-listed common stocks
2. Traded every day, passed our data validation
3. Profitable with positive common equity
4. Advantageous risk-reward: Chicago Quantum Net Score better than for S&P 500 Index ETF
5. Actual dividends paid > S&P 500 Index ETF which paid 1.61% last year
Item 4 is based on our proprietary algorithm that compares historic risk and expected returns.
Item 5 is based on this formula: sum(dividends paid) / average(adjusted closing price) for the past 253 trading days.
It is rare to find a top dividend stock. This usually means the individual stocks have lower than normal price volatility, higher expected returns, or both.
Do your due diligence and learn their stories before you invest.
Ticker |
Company Name |
Dividend (% Actual) |
LNC |
Lincoln National Corp. |
7% |
RILY |
B. Riley Financial Inc |
10% |
WAL |
Western Alliance Bancorp |
3% |
SLG |
SL Green Realty Corp. |
11% |
BX |
Blackstone Inc. |
4% |
TROW |
T. Rowe Price Group Inc. |
4% |
SPY |
S&P 500 Equity Index ETF |
2% |
There are more stocks that meet this criteria. Contact us for more information.
Some stocks pay a consistent dividend that is a sustainable percentage of profits and free cash flow (e.g., 20% to 50%). As the company grows profits and cash flow, it can afford to grow dividends. This works in reverse. When a company becomes less profitable, it feels pressure to shrink or eliminate its dividend. We see evidence of this in our Chicago Quantum Net Score analysis of US-listed stocks.
There are a significant number of companies that paid 7% or more in actual dividend yield over the past year. All of them are listed below (for US-listed stocks that pass our data validation process). Only a few 'money losing' companies pay a 7% or higher dividend, and that number keeps shrinking. We notice high-yielding stocks from 2022 cutting or eliminating their dividends. Buyer beware with dividend stocks. If the dividend is not sustainable in your opinion, and the company cuts the dividend, the stock may be sold off aggressively buy investors and portfolio managers that prefer dividend yielding stocks.
There are exceptions to the 'sustainable dividend' story above. Some companies pay a one-time dividend to return cash to shareholders. This could be due to a windfall profit (e.g., winning a lawsuit), or restructuring their business (e.g., sell or spin-out a business).
Below is a list of listed US common stocks based on their actual payout / average share price over the past year. This is an actual, historical dividend yield for an owner of the stock every day for the past year. This is not a forward-looking dividend yield.
These are the top dividend paying stocks over the past year for companies. A value of 1.10 means the company paid 10% of their average closing price in dividends in the past 253 trading days.
Stocks that paid 15% or more in actual dividends last year (vs. actual average stock price)
ZIM 0.64 Zim Integrated Shipping Services Ltd
ACI 0.35 Albertsons Companies Inc
ICL 0.30 ICL Group Ltd
TRMD 0.29 Torm Plc
CHMI 0.23 Cherry Hill Mortgage Investment Corporation
ORC 0.22 Orchid Island Capital Inc
AFCG 0.21 AFC Gamma Inc
EQC 0.21 Equity Commonwealth
NLY 0.20 Annaly Capital Management Inc
BITO 0.20 ProShares Bitcoin Strategy ETF
LPG 0.20 Dorian LPG Ltd
DSX 0.19 Diana Shipping Inc
CIM 0.19 Chimera Investment Corp
RC 0.19 Ready Capital Corp
IVR 0.19 Invesco Mortgage Capital Inc
MFA 0.19 MFA Financial Inc
IEP 0.19 Icahn Enterprises L P
OXSQ 0.18 Oxford Square Capital Corp
ARI 0.18 Apollo Commercial Real Estate Finance Inc
CION 0.18 CION Invt Corp
ACRE 0.17 Ares Commercial Real Estate Corp
TWO 0.17 Two Harbors Investment Corp
AGNC 0.17 AGNC Investment Corp
GSBD 0.17 Goldman Sachs BDC Inc
BRSP 0.16 BrightSpire Capital Inc
TRIN 0.16 Trinity Capital Inc
EFC 0.16 Ellington Financial Inc
TPVG 0.16 TriplePoint Venture Growth BDC Corp
SACH 0.16 Sachem Capital Corp
CCAP 0.16 Crescent Capital BDC Inc
AMBP 0.15 Ardagh Metal Packaging S.A.
BCSF 0.15 Bain Capital Specialty Finance Inc
OBDC 0.15 Blue Owl Capital Corp
RITM 0.15 Rithm Capital Corporation
LOCO 0.15 El Pollo Loco Holdings Inc
ONTF 0.15 ON24 Inc
KRP 0.15 Kimbell Royalty Partners LP
Past dividends is not a guarantee of future dividends
You should not assume that a company will continue to pay dividends, nor pay them at the same rate. The decision to pay a dividend, and the amount paid, is based on earnings and availability of suitable investments available to the company. Companies change their dividend policies & dividend amounts frequently.
Money losing companies that pay dividends
You may also notice that a few companies are not profitable, but paid significant dividends over the past year. There are three simple cases that we think about:
1. The company was, but is no longer profitable
2. The company is designed to pay dividends based on operating cash flows (e.g., REITS or MLPs) but have 'non-cash' expenses like depreciation or amortization to cause an accounting loss.
3. The company paid a small dividend percentage, but then the stock price declined.
How we calculate dividends
We use a novel method to compare stock dividend payouts. It divides the actual dividends paid by the average closing share price. This is an actual, historical dividend yield for an owner of the stock every day for the past year. This is not a forward-looking dividend yield, which is what you typically see. We use it in our platform.
Dividend payout: (1 + dividend %)
A. 1.15 = 15% payout
B. 1.00 = no dividend
C. 1.012 = 1.2% dividend yield (e.g., stock ABC paid $1.20 last year, and had an average close price of $100)
Do your due diligence, learn their stories, and decide where you will invest. Each of these stocks has a story.
Dividend stocks tend to decline when interest rates rise
We were attracted to a particular dividend stock. It pays a high dividend, generates significant free cash flow, and is a consistent performer. This stock fell almost in lock-step with the rise of interest rates. This is because high dividend stocks can often look like a bond but with equity risk. One current example is Verizon $VZ. The dividends they pay are worth less on a weighted average cost of capital basis (e.g., if you can earn 5.5% in a no-risk US Treasury, the relative value of a 7.5% dividend is lower). Verizon also holds significant amounts of corporate debt, which gets more expensive to renew or roll-over into higher interest rate markets (like we have today).
We were attracted to a particular dividend stock. It pays a high dividend, generates significant free cash flow, and is a consistent performer. This stock fell almost in lock-step with the rise of interest rates. This is because high dividend stocks can often look like a bond but with equity risk. One current example is Verizon $VZ. The dividends they pay are worth less on a weighted average cost of capital basis (e.g., if you can earn 5.5% in a no-risk US Treasury, the relative value of a 7.5% dividend is lower). Verizon also holds significant amounts of corporate debt, which gets more expensive to renew or roll-over into higher interest rate markets (like we have today).
Why invest in dividend-paying stocks?
The simple answer is it reduces your risk. Each year a portion of your investment, or a return on your investment, is paid.
Why avoid dividend-paying stocks?
On the other hand, dividends are taxed twice, once as the company generates the profit to pay them, and twice as you receive the dividend. In most situations, dividends are taxed higher than capital gains, so there is almost a 'triple tax' on dividends.
As an example of double taxation from dividends, a dollar earned by a company yields $0.70 after corporate taxes. They pay the $0.70 to shareholders who then pay Federal and State taxes of 40% on that income, yielding a final amount of $0.42 (out of the original dollar), or a tax of 58%.
Can you avoid double taxation on dividends?
Case 1: Invest in companies that reinvest earnings into growth (e.g., Amazon's strategy) so no tax would be paid and the company is expected to grow future earnings more quickly. In that case, no current tax is paid.
Case 2: Invest in companies that use free cash flow to increase per-share, shareholder equity. In this case, the company earns income, pays corporate taxes of $0.30, and uses the $0.70 (after taxes) to buy back shares of stock or pay down debt. The investor, in theory, could defer their share of taxes indefinitely by not selling their shares, or sells them after a year and pays lower capital gains taxes as low as 15%. In this case, the tax paid in the current year is $0.30 or $0.405 if the stocks were sold after one year.
Case 3: Look into master limited partnerships which pass through to the investor their financial performance and distributions. Their financial performance affects your basis in the stock, and is taxable, which may offset cash distributions at tax time.
Here is a recent video on our top dividend stock service.