Analysis discontinued
Liquidity Research Question
How do changes in liquidity impact expected returns in stocks?
How do changes in volatility, pricing and volume impact liquidity?
How do market makers, and other supplemental liquidity providers (the market) fund liquidity requirements? How much capital is needed to provide that liquidity and is that money always available?
As a market participant, what is the math around market making, liquidity, volatility and price levels?
As an investor, what is the relationship between volatility, liquidity, trading costs, and ultimately, the demand for equities you may want to invest in?
So many questions...so little time to think through them. We will iterate, clarify, and share some insights as we develop them.
Resources
This is the beginning of our research 'reading list' and we are taking good notes. There are already some solid hypotheses forming. Could lead to an NSF Grant in 2022 if this starts to help us predict stock prices so we can build, test and fund a model.
- Fender & Lewrick: Shifting tides – market liquidity and market-making in fixed income instruments (2015)
- Kahraman & Tookes, Trader Leverage and Liquidity (2017)
- SEC August 2017 Report to Congress: Access to Capital and Market Liquidity
- OICU - IOSCO December 2007 Report of the IOSCO Emerging Markets Committee
- Brunnermeier & Pedersen, Market Liquidity and Funding Liquidity (November 2006 version)
- Elliott Market Liquidity: A Primer, The Brookings Institute Economic Studies Fellow (June 2015)
- NYSE Liquidity Providers (Supplemental Liquidity Provider programs) www.nyse.com
- Amiram, Cserna, Levy, Volatility, Liquidity and Liquidity Risk (October 2016 draft)
- Brunnermeier, Pedersen Market Liquidity and Funding Liquidity (NBER Working Paper Series, Feb 2007)
- Drechsler, Moreira, Savov, Liquidity Creation as Volatility Risk (April 2018)
- Brunnermeier, Deciphering the Liquidity and Credit Crunch 2007 - 2008, Journal of Economic Perspectives (Winter 2009)
- Chung, K.H., Chuwonganant, C., Market volatility and stock returns: The role of liquidity providers. Journal of Financial Markets (2017), http://dx.doi.org/10.1016/j.finmar.2017.07.002i
Liquidity Insights
1. Liquidity, Volatility & Expected Returns for US equities have a causal relationship. Most literature suggests an inverse relationship driven by liquidity. In other words: if we have lower liquidity (as if by magic) and higher trading costs, then we will have higher volatility, lower prices and higher expected returns. If you see wider bid-ask spreads and smaller trading volumes, then this is bearish for equity prices.
2. Increases in volume reduce trading costs. Trading cost is a function of v/V, or an average trade size / total trade size. As an aside, this supports why multiple, smaller sized orders execute better than larger orders (outside a dark pool or brokered trade).
3. Anecdote: Yesterday we found a stock that traded with significantly higher volume, but is down ~80%. Today, that stock traded up over 30%. Once the volume level is established higher (some call this a MEME'd stock), retail and wholesale can trade it cheaply, in and out all day, and make significant trading profits. Volume spikes create the environment for price spikes in the short-term. It does not mean up or down, but it means that it can move aggressively either way.
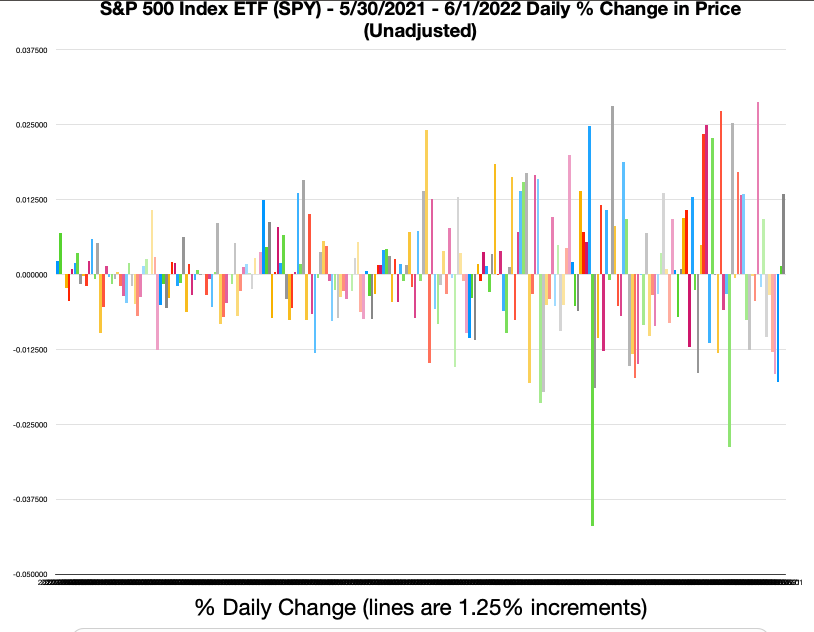
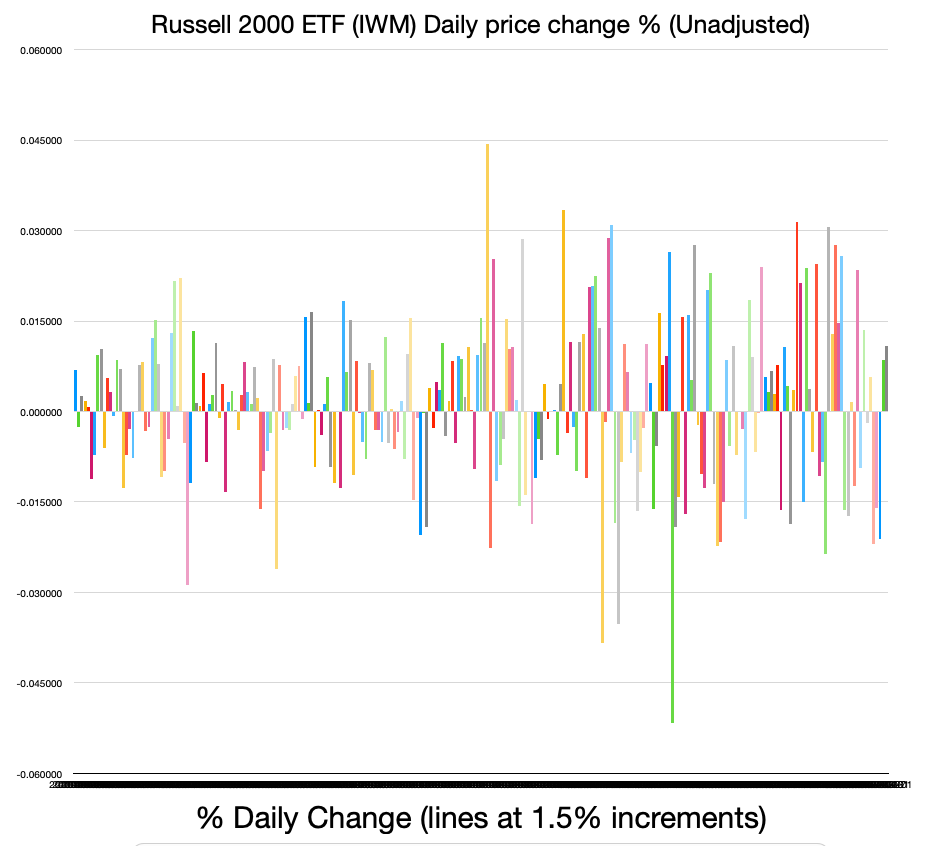
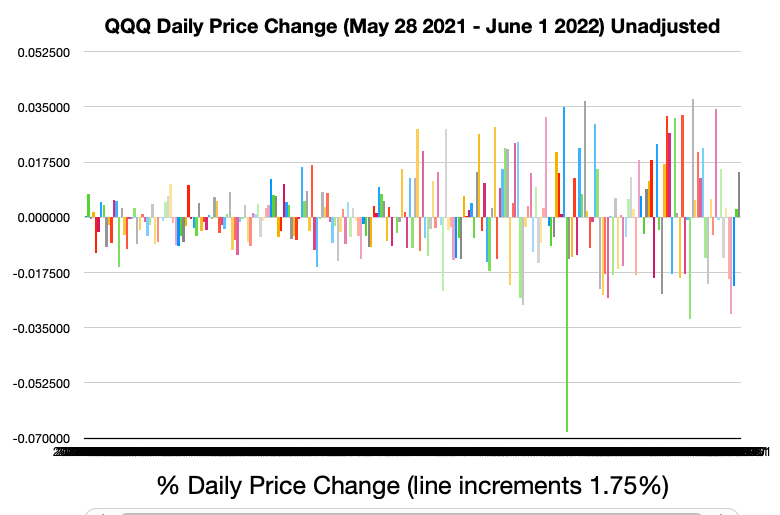
4. June 1, 2022 update. We have gotten used to seeing larger swings in individual stocks and the indices. By larger swings we mean that the S&P 500, Nasdaq Composite 100 or Russell 2000 can move by full percentage points in a single day. You see this by the height of the bars. The three charts below graph daily price changes (unadjusted for dividends) and the system set the price line increments (think of those as similar to standard deviations). It goes from 2021 on the left to 2022 to the right, and this is a year of data for each index ETF. The fact that we see daily price changes touching the 2nd line increment for the last few months could be a reflection of reduced liquidity, or it could be something else entirely. Regardless of the cause, hold on to your seats as we head into Summer, which is normally a slow and down period for stocks. This introduces a new source of lower liquidity. Some market participants are on vacation during the Summer, and the replacements, or new traders, can be students, teachers, or others who are off work in the summer.
2. Increases in volume reduce trading costs. Trading cost is a function of v/V, or an average trade size / total trade size. As an aside, this supports why multiple, smaller sized orders execute better than larger orders (outside a dark pool or brokered trade).
3. Anecdote: Yesterday we found a stock that traded with significantly higher volume, but is down ~80%. Today, that stock traded up over 30%. Once the volume level is established higher (some call this a MEME'd stock), retail and wholesale can trade it cheaply, in and out all day, and make significant trading profits. Volume spikes create the environment for price spikes in the short-term. It does not mean up or down, but it means that it can move aggressively either way.
4. June 1, 2022 update. We have gotten used to seeing larger swings in individual stocks and the indices. By larger swings we mean that the S&P 500, Nasdaq Composite 100 or Russell 2000 can move by full percentage points in a single day. You see this by the height of the bars. The three charts below graph daily price changes (unadjusted for dividends) and the system set the price line increments (think of those as similar to standard deviations). It goes from 2021 on the left to 2022 to the right, and this is a year of data for each index ETF. The fact that we see daily price changes touching the 2nd line increment for the last few months could be a reflection of reduced liquidity, or it could be something else entirely. Regardless of the cause, hold on to your seats as we head into Summer, which is normally a slow and down period for stocks. This introduces a new source of lower liquidity. Some market participants are on vacation during the Summer, and the replacements, or new traders, can be students, teachers, or others who are off work in the summer.
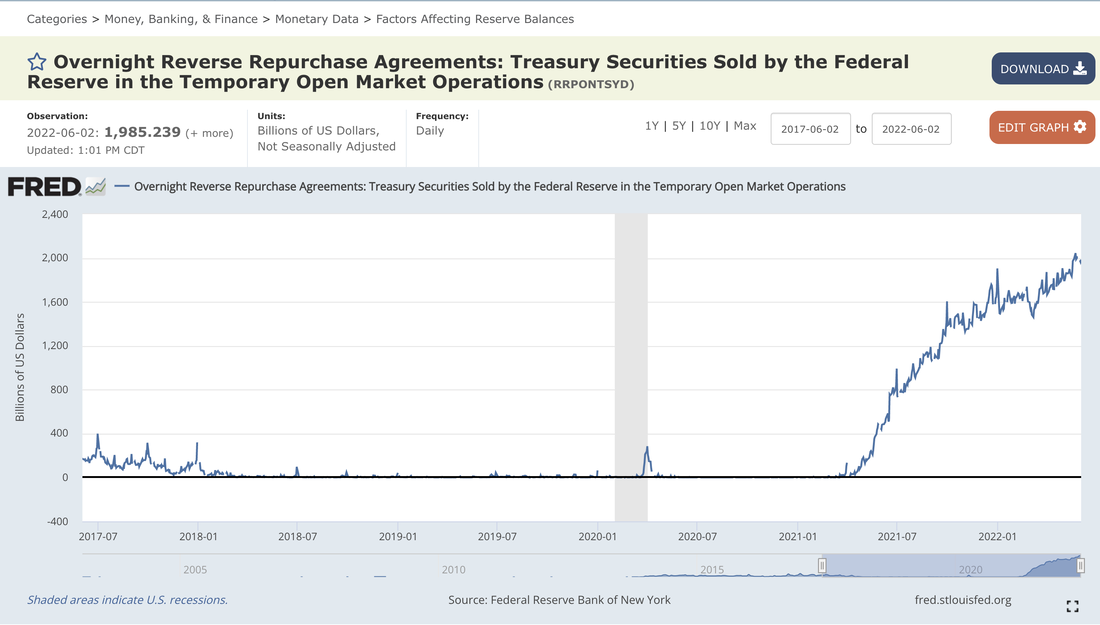
5. So, we found where one trillion USD of US-based liquidity went. It went into US Federal Reserve Bank: Overnight Reverse Repurchase Agreements. This is where US financial institutions can park excess money (or reserves) overnight at the FED for 0.08% annual interest. It isn't much, but it adds up on $2T. In August 2021, this was right at $1T (so an extra trillion dollars is being parked at the fed over the past 10 months, every night). In recent history, $0.4T was a big number for this statistic, and now we are at 5x that amount.
You can find the current overnight reverse repo figures here: https://fred.stlouisfed.org/series/RRPONTSYD
Thank you FRED (St. Louis Fed).
This is money the banks can be providing to traders and market makers to invest or use in the stock and bond markets, but are either choosing not to, or are not being asked. This is a sign of reduced liquidity or reduced demand for liquidity in the US equity markets.
By contract, in 1929 during the great run-up and crash, the banks were heavily 'invested' in margin loans. In fact, many corporations took up side businesses lending money to market makers and speculators and lent them money for US equity market operations and speculation.
Overnight Reverse Repurchase Agreements: $1.99T
— Chicago Quantum (@chicago_quantum) June 3, 2022
This is where the trillion USD in liquidity went
August 11 it was $1.0T
When a US financial institution has idle money overnight, it can 'park' it at the Fed to earn 0.08% (annual)https://t.co/ZFZc4VnNEc pic.twitter.com/ViMYcbrq5P