Kurtotic Stock Distribution - Additional Details
- Can you show us an example of a stock with a leptokurtic distribution?
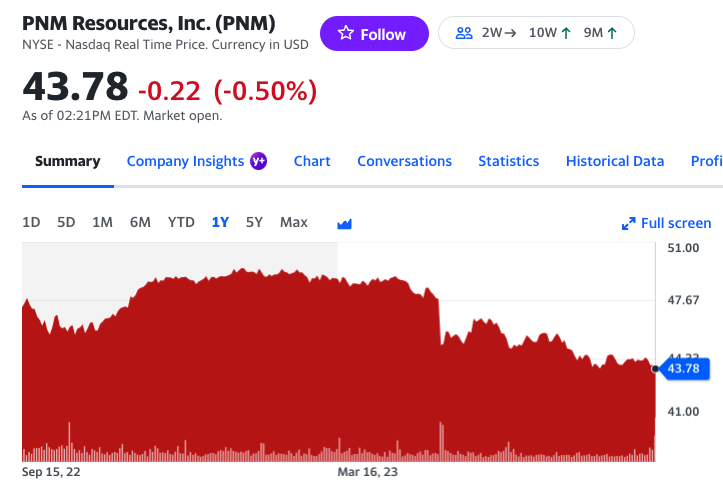
Here is a discussion of a leptokurtic stock with real data (Source: Yahoo Finance on Sept 15, 2023).
We post charts to show this.
Chart 1: Price over the measurement period of one year
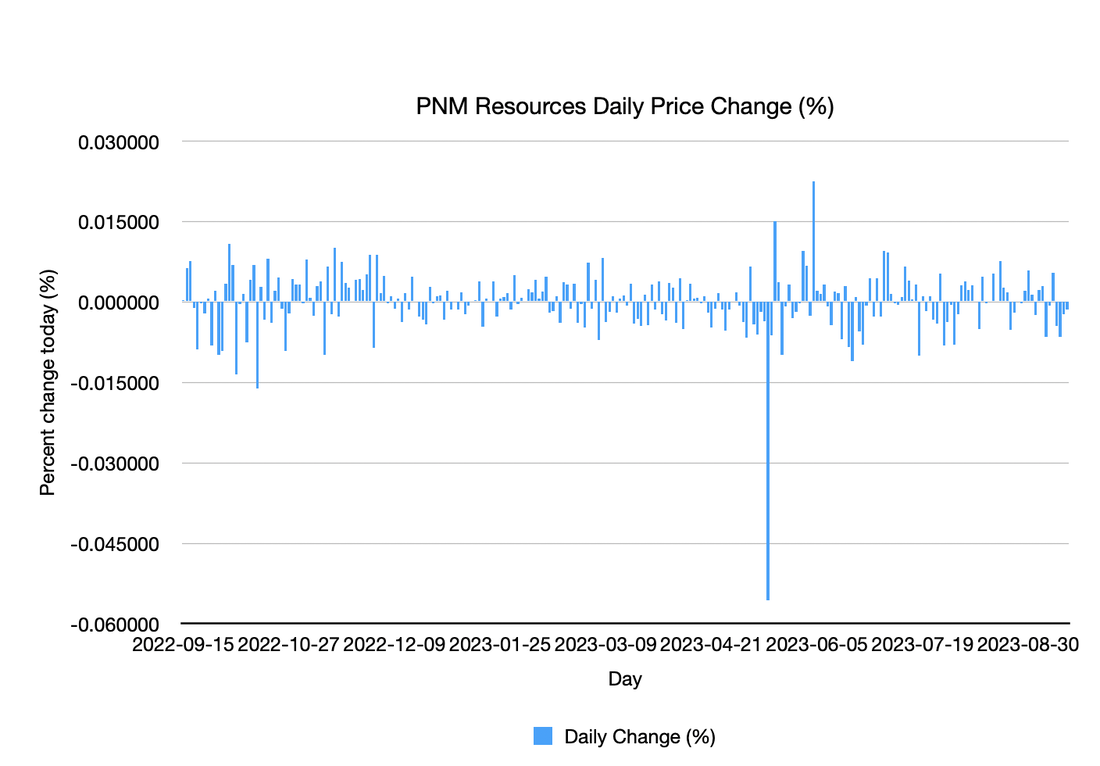
Chart 2: Time-series of price changes per day
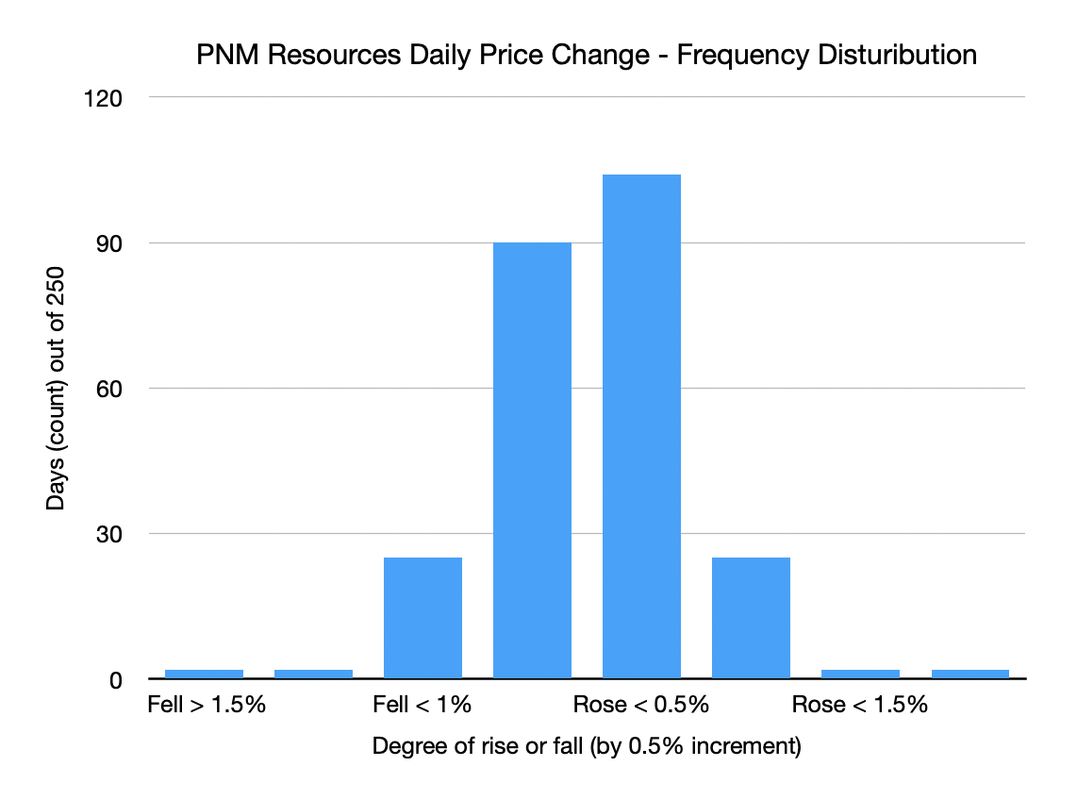
Chart 3: Frequency Distribution (this is the bell shaped curve with the narrow body we were looking for).
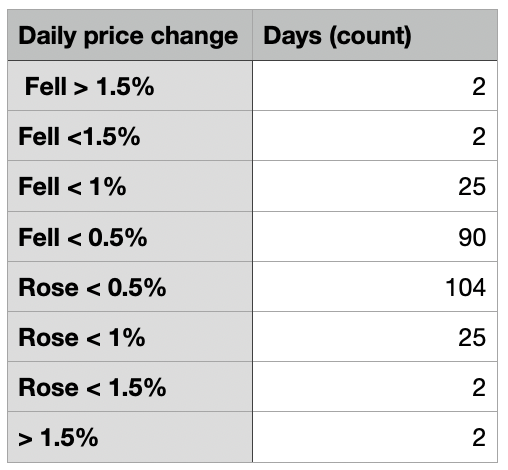
Chart 4: Summary frequency data
The initial chart looks pretty normal, if not pretty risky. Maybe a bad earnings call, but then the stock tried to close the gap and failed, falling further.
The time-series of prices shows the few days when the stock moved more than 1.5% in a day (which is not a big move for a US stock) out of 250 price change measurements. You can see the two moves that blew out the chart. Even after those big moves, the stock fell back into the pattern of small daily price moves.
The third chart shows how the stock rarely moved more than 1%, only doing this 8 times out of 250 days. The variance of this stock is low, which allows us to see the kurtotic nature very clearly. Most moves are within 0.5%, either up or down.
The final chart shows the raw data, so you can recreate the chart. We did divide the six days of no change into three up and three down less than 0.5%.
The idea of a leptokurtic and low variance stock is that it allows the investor to rest easy most days, but there is that real, and non-normal 'aggressive' probability of a big move on occasion. In this case, the stock moved less than 1% almost every day (242 out of 250 days), but on one day it fell dramatically.
Investor Expectations & Possible Trading Implications
Investors may expect a normal distribution of stock prices. Stocks go up and down seemingly randomly along with expectedly random new information. However, with a stock with a leptokurtic distribution, the investor sees typical observations closer to the mean. There is also more of a chance that a future observation will be an outlier. When plotted, the peak is taller and narrower (typical observations closer to the mean) and the tails rise up from the x-axis (more frequent outliers).
This provides information for a unique trading opportunity in stocks and stock options.
This way, these stocks will typically have smaller movements, and lower implied volatility, which reduces the cost of stock options, but still have the ability to surprise with a large standard deviation move. We believe the combination of leptokurtic and low variance gives an options trader a chance to invest less money buying an option, predict a direction of surprise, and earn profits as the stock eventually makes its big more.
At least, this is our hypothesis on how it should work. No trading strategy is fool-proof. We have felt foolish on a few of our leptokurtic options bets where the options seemed cheap, but we bet on a move in the wrong direction.

This church represents a leptokurtic distribution. The peak is high and narrow, and the tails are wide and sloping.
If you made it this far, then you deserve a MEME.
Thank you imgflip.com