Stock Market and Portfolio Optimization Research
2023 kurtosis research on daily returns
Research on Platykurtic and Leptokurtic Stock daily price returns.
Net-net: We measured the daily stock price returns for leptokurtic and platykurtic stocks, and found there was a significant difference between them. The difference was found in the median return and the range when compared to the overall market index.
We ran a 'public' test to see whether a set of leptokurtic stocks and platykurtic stocks behave differently than each other. Our hypothesis is that they will act very differently around range of daily returns, median return, number of stocks that advance in price). We will control for overall market returns based on the daily return of the S&P 500 Index.
Initial observations with new dataset (Day 1).
1. The platykurtic and leptokurtic stock populations both had median returns in line with return of the S&P 500 Index.
2. The ranges of these stock samples was 6.76% for the Leptokurtic stocks, and 10.75% for the platykurtic stocks.
3. Both populations had fewer stocks rise than fall today.
Day 3: I realize that we have different sample sizes, so these findings should be taken with a grain of salt.
1. It looks like platykurtic stocks at the median perform more similarly to the S&P 500, and the leptokurtic stocks median over-shoots or under-shoots it more.
2. The platykurtic range may be smaller than the leptokurtic range, despite having ~ 2x the number of stocks.
On January 13, we changed our population. We started collecting new data.
We will use the leptokurtic and low variance stocks, along with the platykurtic and low variance stocks that we find in the model. We want to isolate the impact that high variance was having on the data set. Both populations will have the same variance (</= the variance of the population they were measured from), and the standardized kurtosis test.
Over the weekend before Jan 16, we will review the setting to create a more even set of stocks to compare. The sample sizes may cause anomalies (e.g., one set is 2x the other set, and could explain greater range of daily price change values).
LEPTOKURTIC AND LOW VARIANCE STOCKS (37 ON FRI JAN 13)
Date, largest daily loss (%), largest daily gain (%), median daily return (%), number of gainers (out of 37), S&P 500 daily performance (%)
Jan 17: -2.48, 4.28, -0.21, 16, -0.20,
Jan 18: -4.21, 2.60, -1.96, 5, -1.56
Jan 19: -5.88, 2.58, -0.47, 7, -0.76
Jan 23: -2.70, 3.83, 0.29, 23, 1.20
Jan 24: -4.06, 2.52, -0.08, 17, -0.07
PLATYKURTIC AND LOW VARIANCE STOCKS (72 ON FRI JAN 13)
Date, largest daily loss (%), largest daily gain (%), median daily return (%), number of gainers (out of 72), S&P 500 daily performance (%)
Jan 17: -4.60, 6.15, -0.27, 30, -0.20,
Jan 18: -4.06, 1.0, -1.60, 5, -1.56
Jan 19: -3.40, 1.71, -0.74, 15, -0.76
Jan 23: -2.51, 4.32, 0.40, 46, 1.20
Jan 24: -6.71, 3.70, 0.22, 43, -0.07
We have 24 stocks that passed our test for being Leptokurtic (Standardized Kurtosis > 4.5) and Low Variance for the year through 12/30/2022. They are both profitable and unprofitable companies. All are US listed common stocks. We exclude stocks that fail data validation.
LEPTOKURTIC AND LOW VARIANCE STOCKS
Date, largest daily loss (%), largest daily gain (%), median daily return (%), number of gainers (out of 24), S&P 500 daily performance (%)
Jan 3: -2.22, 3.29, 0.07, 13, -0.4
Jan 4: -0.76, 3.89, 0.62, 18, 0.75
Jan 5: -2.04, 3.42, 0.18, 12, -1.16
Jan 6: -7.08, 3.13,1.90 , 21, 2.28
Jan 9: -7.74,-1.71, -1.29, 2, -0.08
Jan 10: -2.31,2.40,0.06,9, 0.70
Jan 11: -2.14, 5.37, 0.12, 14, 1.28
Jan 12: -3.31, 7.02, 0.00, 9, 0.34
Jan 13: -1.13, 1.53, 0.33, 13 0.40
FINAL DATA COLLECTED
We have 105 stocks* that passed our test for being Platykurtic (standardized kurtosis < 1.5) and High Variance for the year through 12/30/2022. They are both profitable and unprofitable companies. All are US listed common stocks. We exclude stocks that fail data validation.
Date, largest daily loss (%), largest daily gain (%), median daily return (%), number of gainers (out of 24), S&P 500 daily performance (%)
Jan 3: -12.24, 10.35, -3.15, 18, -0.4
Jan 4: -6.07, 24.12, 2.12, 88, 0.75
Jan 5: -11.31, 4.96, -1.06, 32, -1.16
Jan 6: -3.92, 32.08, 2.46, 86, 2.28
Jan 9: -8.37, 19.80, 2.13, 80, -0.08
Jan 10: -3.63,17.35,1.92,79,0.70
Jan 11: -6.61, 12.52, 1.53, 78,1.28
Jan 12: -4.32, 11.08, 0.76, 68, 0.34
Jan 13: -10.64, 14.20, 0.72, 69, 0.40
FINAL DATA COLLECTED
* We may reduce the number of platykurtic and high variance stocks in future work.
** We are completing this analysis, and replacing it with a new run of stocks and a new platykurtic stock definition.
FINAL DATA COLLECTED
Initial observations:
1. There are 75% fewer Leptokurtic stocks with low variance (based on our conditions) than platykurtic stocks with high variance
2. Leptokurtic stocks have smaller range in daily price changes than platykurtic stocks
3. Leptokurtic stocks have a smaller median price change than platykurtic stocks
4. Platykurtic stocks had a higher percentage of stocks that declined in value. Our first day of the 2023 trading year saw 83% of platykurtic and high variance stocks fall.
5. Leptokurtic stocks did better than the platykurtic stocks on down days, and worse on up days.
Secondary observations (Jan 9):
The range of daily price moves in platykurtic and high variance stocks is enormous, and even the daily median move is quite high at an average over 2% per day. These stocks really move, and there is a large sample of them (105).
The leptokurtic stocks did not do well on January 9, and underperformed the market.
On Jan 11, we see that this market favors the riskiest stocks with a significant upside bias.
On Jan 13, we realize the range on the 105 stocks with platykurtic and high variance are significant. This 'breaks' our hypothesis that platykurtic stocks are less risky, even with higher variance. It also suggests that the variance characteristic vastly outweighs the kurtosis characteristic in today's market.
Our model uses two key parameters. The first is the floor rate of return for the three US equity indices we use (SPY, QQQ and IWM). The second is a risk-free rate of return for the average investor for short-term deposits.
Two definitions:
Two definitions:
- Our Risk-free rate is the rate you can earn without risk. Short-term money (e.g., 13 week US Treasury securities).
- Our market return 'floor' rate is the assumed (or expected) return to the stock market for these indices over the next 12 months, including dividends. It fluctuates between 20% and 5.4%, and includes a dividend payout rate.
Insights from our analysis
Insights from our Chicago Quantum Net Score Data Analysis
Sunday, April 3, 2022
By: Jeffrey Cohen, Investment Advisor Representative & President
US Advanced Computing Infrastructure Inc.
PART 1: SHOULD INVESTORS INVEST IN STOCKS OF MONEY LOSING COMPANIES?
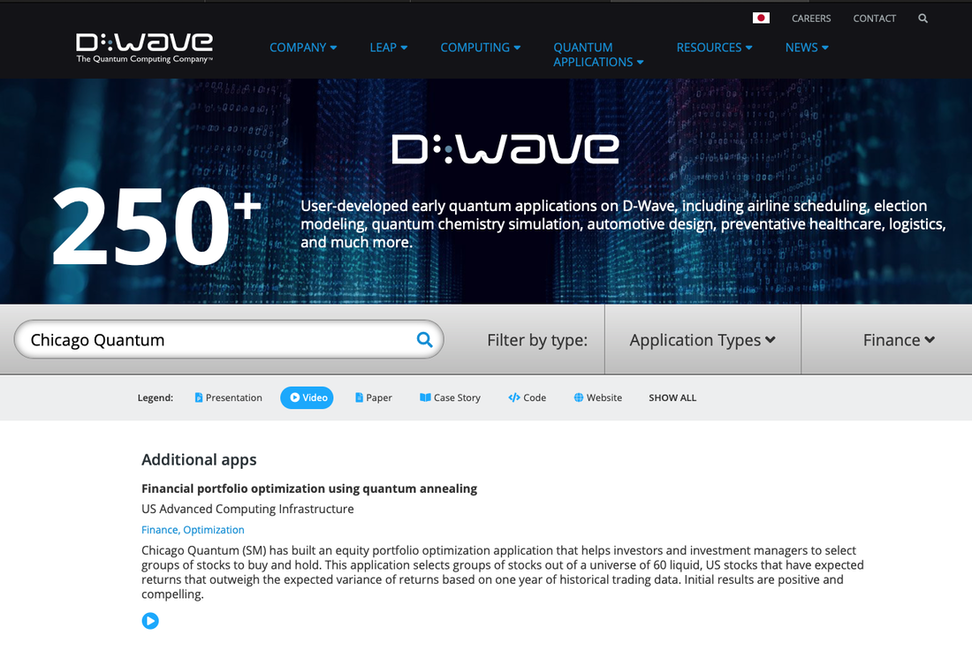
Should investors invest in validated, US listed stocks that lose money, or more precisely have negative net income. The simple answer is that our model found only 8 stocks out of 1,157 that would be more efficient (higher expected returns vs. stock price variance) than buying a broadly diversified portfolio.
We see four portfolios that are more efficient to hold than investing in individual money losing companies:
We answer this question during a time of moderating market returns. The ‘forward’ one-year expected market return is 8.13% for a balanced portfolio of $SPY, $IWM and $QQQ, using a risk-free rate of 1.00%.
Stock Price Volatility
Money losing companies stocks have a higher daily price variance than those that make money, often by a factor of 2:1 to 3:1. Today’s ratio is 3.42 x 10⁻⁴ / 1.18 x 10-4 = 2.89.
Expected Returns
Money losing companies stocks have a higher BETA and therefore a higher expected return in the coming year than money-losing company stocks. Expected Return = 11.84% / 9.14% = 1.295.
We believe the greater risk outweighs the greater expected returns during times of moderating market returns. Investors should avoid holding individual stocks in companies with negative net income. They should either focus on profitable companies, or in buying a broadly diversified portfolio such as $SPY, $QQQ or $IWM.
PART 2: HOW CAN WE PROFIT FROM STOCKS OF MONEY-LOSING COMPANIES?
We did find small portfolios that would be the most inefficient you could hold. We say small portfolios because diversification of risk increases efficiency, so these portfolios have between one and three stocks, held equally.
Inefficient portfolios have significantly more risk than expected return, when normalized against the ‘all stock’ portfolio above (#2), or the $SPY.
We call these our CQNS DOWN portfolios, because they are portfolios of stocks you should avoid holding, or can bet against after they move higher. They have seen significant daily price variance without significant BETA values.
Sometimes you cannot short these stocks because they are not available to be borrowed. In those cases, you may be able to buy puts or sell calls.
PART 3: HOW IS THIS DIFFERENT FOR STOCKS OF MONEY MAKING COMPANIES?
Investors have a better chance investing in stocks of companies that make money. In contrast to the 8 / 1,157 stocks (0.0069) that were more efficient than $SPY, 124 individual stocks of money-making companies, or 124/2,399 stocks (0.052), were more efficient than the $SPY, $IWM or a broadly diversified portfolio.
We found larger portfolios (from 2 to 14 stocks) that are significantly more efficient than a fully diversified portfolio. Your choice of efficient investments is diverse and allows for different types of stocks to be held.
However, if you are not confident in picking individual stocks or stock portfolios, a broadly diversified portfolio is a very efficient and ‘safe’ choice.
Also, if you are not confident in the direction of the overall market, then just choosing portfolios on the basis of efficiency could leave you with a significant BETA value of your stocks, which will overstate market movements in your portfolio. You win in advancing US equity markets but you lose in declining US equity markets.
Sunday, April 3, 2022
By: Jeffrey Cohen, Investment Advisor Representative & President
US Advanced Computing Infrastructure Inc.
PART 1: SHOULD INVESTORS INVEST IN STOCKS OF MONEY LOSING COMPANIES?
Should investors invest in validated, US listed stocks that lose money, or more precisely have negative net income. The simple answer is that our model found only 8 stocks out of 1,157 that would be more efficient (higher expected returns vs. stock price variance) than buying a broadly diversified portfolio.
We see four portfolios that are more efficient to hold than investing in individual money losing companies:
- The $IWM, or the iShares Russell 2000 ETF
- A portfolio of all 1,157 common stocks of money-losing companies
- The $QQQ, or the Invesco QQQ Trust Series 1 (ETF)
- The $SPY, or the S&P 500 ETF Trust ETF
We answer this question during a time of moderating market returns. The ‘forward’ one-year expected market return is 8.13% for a balanced portfolio of $SPY, $IWM and $QQQ, using a risk-free rate of 1.00%.
Stock Price Volatility
Money losing companies stocks have a higher daily price variance than those that make money, often by a factor of 2:1 to 3:1. Today’s ratio is 3.42 x 10⁻⁴ / 1.18 x 10-4 = 2.89.
Expected Returns
Money losing companies stocks have a higher BETA and therefore a higher expected return in the coming year than money-losing company stocks. Expected Return = 11.84% / 9.14% = 1.295.
We believe the greater risk outweighs the greater expected returns during times of moderating market returns. Investors should avoid holding individual stocks in companies with negative net income. They should either focus on profitable companies, or in buying a broadly diversified portfolio such as $SPY, $QQQ or $IWM.
PART 2: HOW CAN WE PROFIT FROM STOCKS OF MONEY-LOSING COMPANIES?
We did find small portfolios that would be the most inefficient you could hold. We say small portfolios because diversification of risk increases efficiency, so these portfolios have between one and three stocks, held equally.
Inefficient portfolios have significantly more risk than expected return, when normalized against the ‘all stock’ portfolio above (#2), or the $SPY.
We call these our CQNS DOWN portfolios, because they are portfolios of stocks you should avoid holding, or can bet against after they move higher. They have seen significant daily price variance without significant BETA values.
Sometimes you cannot short these stocks because they are not available to be borrowed. In those cases, you may be able to buy puts or sell calls.
PART 3: HOW IS THIS DIFFERENT FOR STOCKS OF MONEY MAKING COMPANIES?
Investors have a better chance investing in stocks of companies that make money. In contrast to the 8 / 1,157 stocks (0.0069) that were more efficient than $SPY, 124 individual stocks of money-making companies, or 124/2,399 stocks (0.052), were more efficient than the $SPY, $IWM or a broadly diversified portfolio.
We found larger portfolios (from 2 to 14 stocks) that are significantly more efficient than a fully diversified portfolio. Your choice of efficient investments is diverse and allows for different types of stocks to be held.
However, if you are not confident in picking individual stocks or stock portfolios, a broadly diversified portfolio is a very efficient and ‘safe’ choice.
Also, if you are not confident in the direction of the overall market, then just choosing portfolios on the basis of efficiency could leave you with a significant BETA value of your stocks, which will overstate market movements in your portfolio. You win in advancing US equity markets but you lose in declining US equity markets.
Insights from our CQNS model:
Jan 31, 2022: Buy stocks with positive net income. They have lower price volatility relative to expected returns.
Feb 2, 2022: Stocks volatility follows an ARCH distribution, and stocks with higher volatility have lower liquidity (all else being equal). During times of market stress, liquidity providers have less liquidity, which creates a synergistic 'do loop of pain' on highly volatile stocks. We saw that today on February 2, 2022 when the indices did well but individual stocks we follow were punished almost universally. The top 65 stocks picked in our CQNS "DOWN" runs from January 5 through February 1 2022 had 59 down and 8 up today.
Feb 25, 2022: Positive net income stocks (which pass our data validation) have lower price variance and lower expected returns than unprofitable ones. In other words, CQNS UP run stocks are expected to be less risky, and less profitable to own, on average. However, once you optimize these stocks, you can pick better combinations to increase expected returns and/or decrease variance than compared to the average. Mathematically, we set the CQNS score for all stocks to ~zero, and portfolios with negative CQNS scores are better than that average.
* CQNS Down Run: 1,140 stocks through Feb 23, 2022 variance 3.2 x 10⁻⁴, expected return 8.4%
* CQNS Down Run: 2,366 stocks through Feb 23, 2022 variance 1.2 x 10⁻⁴, expected return 6.5%
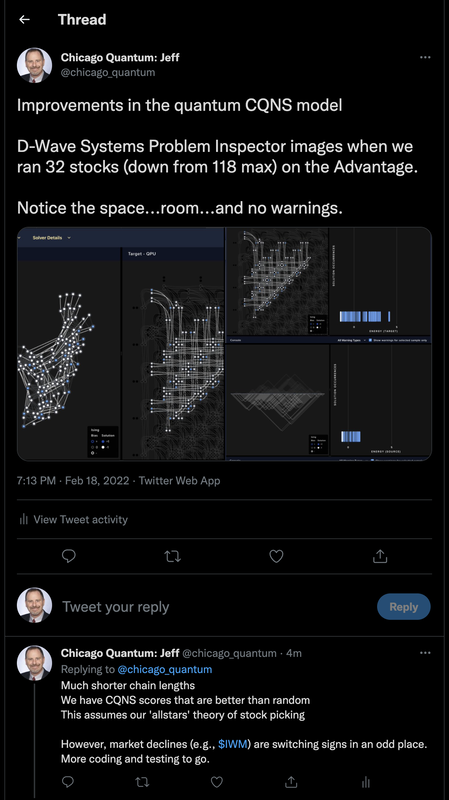
Feb 18, 2022: Re-coding our quantum annealer version of CQNS
Dramatic improvements in the results.
Our latest paper (3 of 3): Portfolio Optimization of 3,171 Stocks
Authors: Jeffrey Cohen & Clark Alexander
Date: October 30, 2020
Date: October 30, 2020
Abstract: We analyze 3,171 US common stocks to create an efficient portfolio based on the Chicago Quantum Net Score (CQNS) and portfolio optimization. We begin with classical solvers and incorporate quantum annealing. We add a simulated bifurcator as a new classical solver and the new D-Wave Advantage(TM) quantum annealing computer as our new quantum solver.
15 pages, 9 figures.
Quantum Physics (quant-ph); Portfolio Management (q-fin.PM)
Cite as: arXiv:2011.01308 [quant-ph]
15 pages, 9 figures.
Quantum Physics (quant-ph); Portfolio Management (q-fin.PM)
Cite as: arXiv:2011.01308 [quant-ph]
Article 3 walk through & Nov 14, 2020 research update
Recent presentations of our work
|
Washington DC Quantum Computing Meetup: Sept 9 {completed}
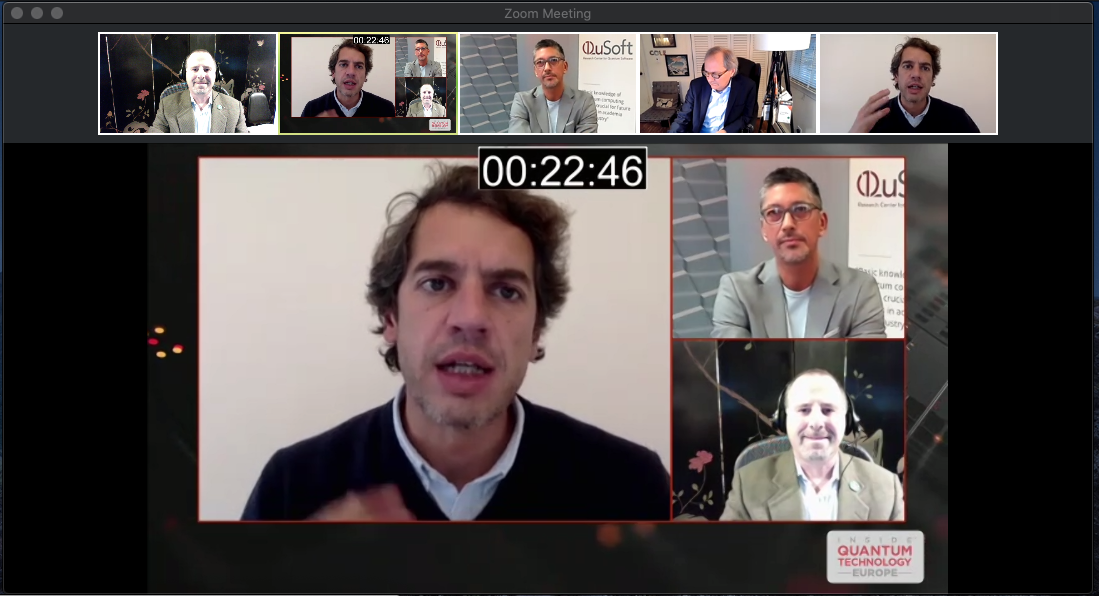
"The race is on...Quantum Annealing vs. other methods we learned". A successful, 2-hour discussion. Zen4Quantum Meetup: Sept 18 {completed} "Quantum Stock Portfolios - Chicago Quantum Talk Series Part 2". An enjoyable 2-hour discussion where we discuss our goals, accomplishments, challenges, and newest methods. Recording here FS Club (London): Sept 21 {completed] "The Right Balance? Using a Quantum Annealing Computer for your Portfolio". A fast-paced 45 minute discussion on the the performance of published portfolios, the 'rig' we use, and our thoughts on scaling up further. Recording here Qubits 2020: Sept 28 {Completed} Recording here IQT Europe: Oct 28 (Financial Services Panel Discussion) Recording here
|

|

| ||
Our 2nd paper (2 of 3): Portfolio Optimization of 60 Stocks
Authors: Jeffrey Cohen, Alex Khan, Clark Alexander
Date: August 19, 2020
Abstract: We continue to investigate the use of quantum computers for building an optimal portfolio out of a universe of 60 U.S. listed, liquid equities. Starting from historical market data, we apply our unique problem formulation on the D-Wave Systems Inc. D-Wave 2000Q (TM) quantum annealing system (hereafter called D-Wave) to find the optimal risk vs return portfolio. We approach this first classically, then using the D-Wave, to select efficient buy and hold portfolios. Our results show that practitioners can use either classical or quantum annealing methods to select attractive portfolios. This builds upon our prior work on optimization of 40 stocks.
Comments:19 pages, 15 figures, 21 references
Subjects:General Finance (q-fin.GN); Quantum Physics (quant-ph)
Cite as:arXiv:2008.08669 [q-fin.GN]
Our 1st paper (1 of 3): Portfolio Optimization of 40 Stocks
Authors: Jeffrey Cohen, Alex Khan, Clark Alexander
Date: July 6, 2020
Abstract: We investigate the use of quantum computers for building a portfolio out of a universe of U.S. listed, liquid equities that contains an optimal set of stocks. Starting from historical market data, we look at various problem formulations on the D-Wave Systems Inc. D-Wave 2000Q(TM) System (hereafter called D-Wave) to find the optimal risk vs return portfolio; an optimized portfolio based on the Markowitz formulation and the Sharpe ratio, a simplified Chicago Quantum Ratio (CQR), then a new Chicago Quantum Net Score (CQNS). We approach this first classically, then by our new method on D-Wave. Our results show that practitioners can use a D-Wave to select attractive portfolios out of 40 U.S. liquid equities.
Comments:15 pages, 8 figures
Subjects:General Finance (q-fin.GN); Quantum Physics (quant-ph)
Cite as:arXiv:2007.01430 [q-fin.GN]