Platykurtic U.S. common stocks: June 12, 2024
- Stocks with a platykurtic distribution.
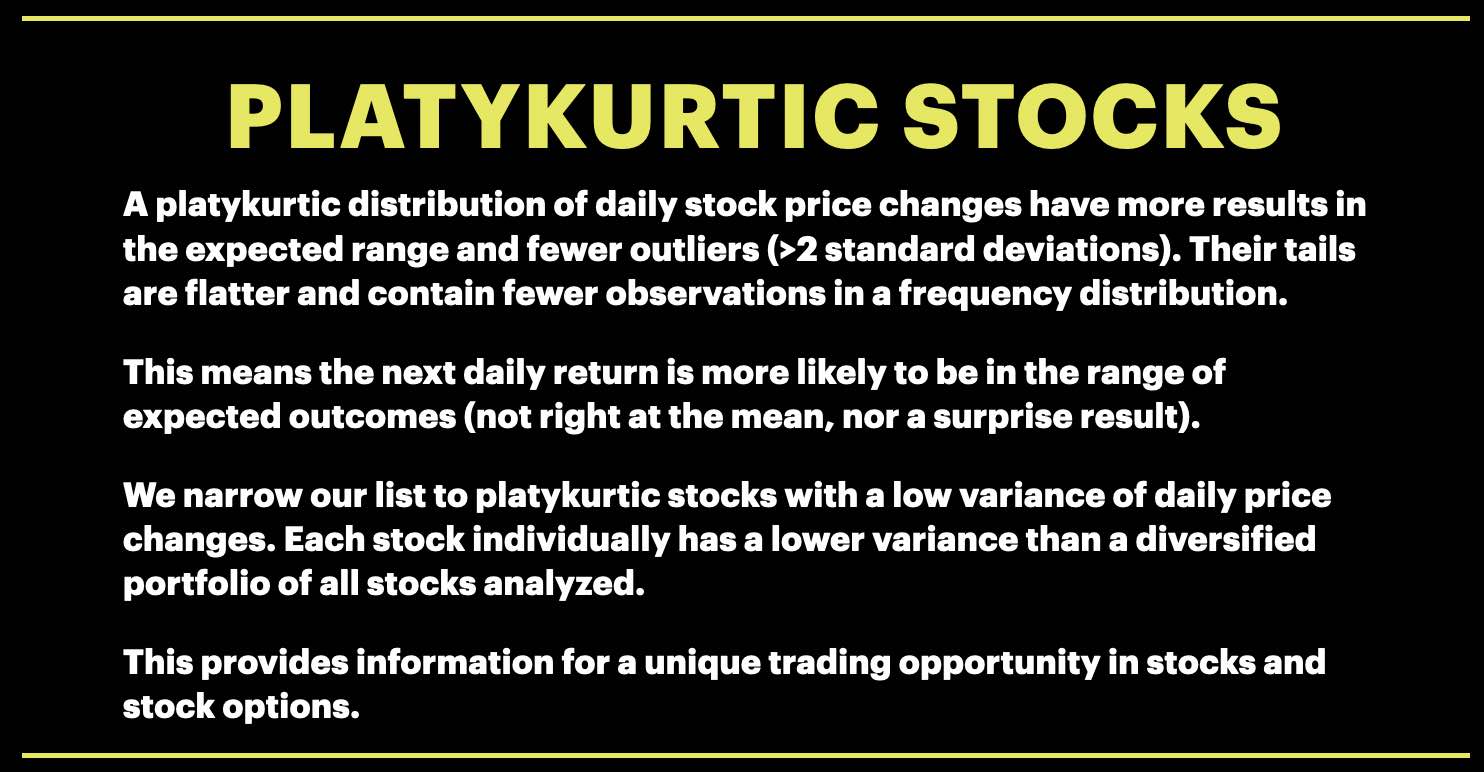
- What it means for a stock to have a platykurtic distribution.
- Show a platykurtic distribution example.
A platykurtic stock has a standardized kurtosis score that is less than a normal distribution value of three (K < 3.0). Kurtosis is the fourth central movement of a distribution. We filter the list to include stocks with K < 1.25 and stock price variance lower than the market as a proprietary choice.
Visualization:
1) a platykurtic stock distribution has fewer outliers than a normal stock price distribution, so imagine the roll of a fair, six-sided die. There are no outliers, and a die is perfectly platykurtic.
2) a platykurtic stock likely has significant liquidity so that if one side of the trade wants to drive the stock up or down, the other side is right there with plenty of buying or selling power to take the other side of the trade.
3) a platykurtic stock with low variance just did not see outlier moves last year...it was more predictable within the expected range of daily stock price changes.
The S&P 500 Equity Index ETF is a highly platykurtic stock and has been for a while.
Platykurtic and low variance stocks:
Here is the sorted list of the platykurtic and low variance stocks we found today, with ticker, standard kurtosis score, and normalized variance over the past year:
SPY -0.026 0.0000095
EPD -0.010 0.0000074
L 0.065 0.0000145
PNNT 0.192 0.0000198
WMB 0.280 0.0000206
PBA 0.311 0.0000174
OBDC 0.377 0.0000133
V 0.390 0.0000140
CTO 0.416 0.0000206
BCSF 0.450 0.0000191
ET 0.495 0.0000164
EQC 0.591 0.0000120
MPLX 0.651 0.0000075
KMI 0.681 0.0000196
MAIN 0.704 0.0000120
SLRC 0.739 0.0000132
MFIC 0.746 0.0000185
YUM 0.860 0.0000186
CCAP 0.881 0.0000204
ATO 0.960 0.0000196
ARCC 0.961 0.0000105
TJX 1.044 0.0000192
PM 1.047 0.0000183
BRK.B 1.117 0.0000108
OTIS 1.186 0.0000199
A short video to describe our platykurtic stock service.