Leptokurtic U.S. common stocks: June 12, 2024
- Stocks with a leptokurtic distribution and low stock price variance.
- What it means for a stock to have a leptokurtic distribution.
- Show a leptokurtic distribution example.
A Leptokurtic distribution has a standardized kurtosis score that is greater than a normal distribution value of three (K > 3.0). We set our limit to K > 4.75.
We also filter for stocks with a lower variance as a proprietary choice.
Kurtosis is the fourth central movement of a distribution. It is one way to measure whether a random variable has a normal distribution. We use the kurtosis of a year's worth of daily stock price changes, along with the variance of those changes, to better predict whether a stock could surprise us in the future with a big move (either up or down).
Visualizations:
1) The frequency distribution (or bell shaped curve chart) of daily stock price changes is lifted off the X-axis, giving more room in the tails for observations greater than 2 standard deviations from the mean.
2) The center of the bell shaped curve is squeezed to be thinner and taller, fitting more observations within 1 standard deviation of the mean.
A stock that has both a leptokurtic stock price distribution and a low daily stock price variance appears safer when compared to a normally distributed stock. Options premia may be smaller for these stocks than they should be. These could appear to be 'flight to safety' stocks. We generally see large retailers, consumer products companies, defense contractors, drug companies, and publicly regulated utilities in this category.
What makes these different is that every once in a while, these stocks move aggressively...more so than a normally distributed stock.
All stock run (ticker, standard kurtosis score, variance over past year)
Kurtosis is a stock price change distribution that has too few or too many daily price changes in the outliers, or tails. A leptokurtic stock has more outliers, fatter tails, and usually a more narrow and tall peak around the mean daily change. A leptokurtic stock with low variance generally does not change much each day, but when it does, it can see a big move up or down.
Here is the sorted list of the leptokurtic and low variance stocks we found today, with the ticker, standardized kurtosis score, and variance over the past year:
AMED 32.424 0.0000056
WMT 20.877 0.0000215
LMT 18.446 0.0000211
OCSL 17.076 0.0000191
GD 14.391 0.0000209
WM 10.368 0.0000188
FSK 9.702 0.0000143
SLF 7.352 0.0000215
KMB 6.319 0.0000198
JNJ 6.248 0.0000193
AME 5.957 0.0000206
MMC 5.675 0.0000155
MA 5.526 0.0000172
KO 5.390 0.0000127
LIN 5.103 0.0000206
In conclusion, there are only a few stocks with a leptokurtic distribution and low variance of daily stock price changes.
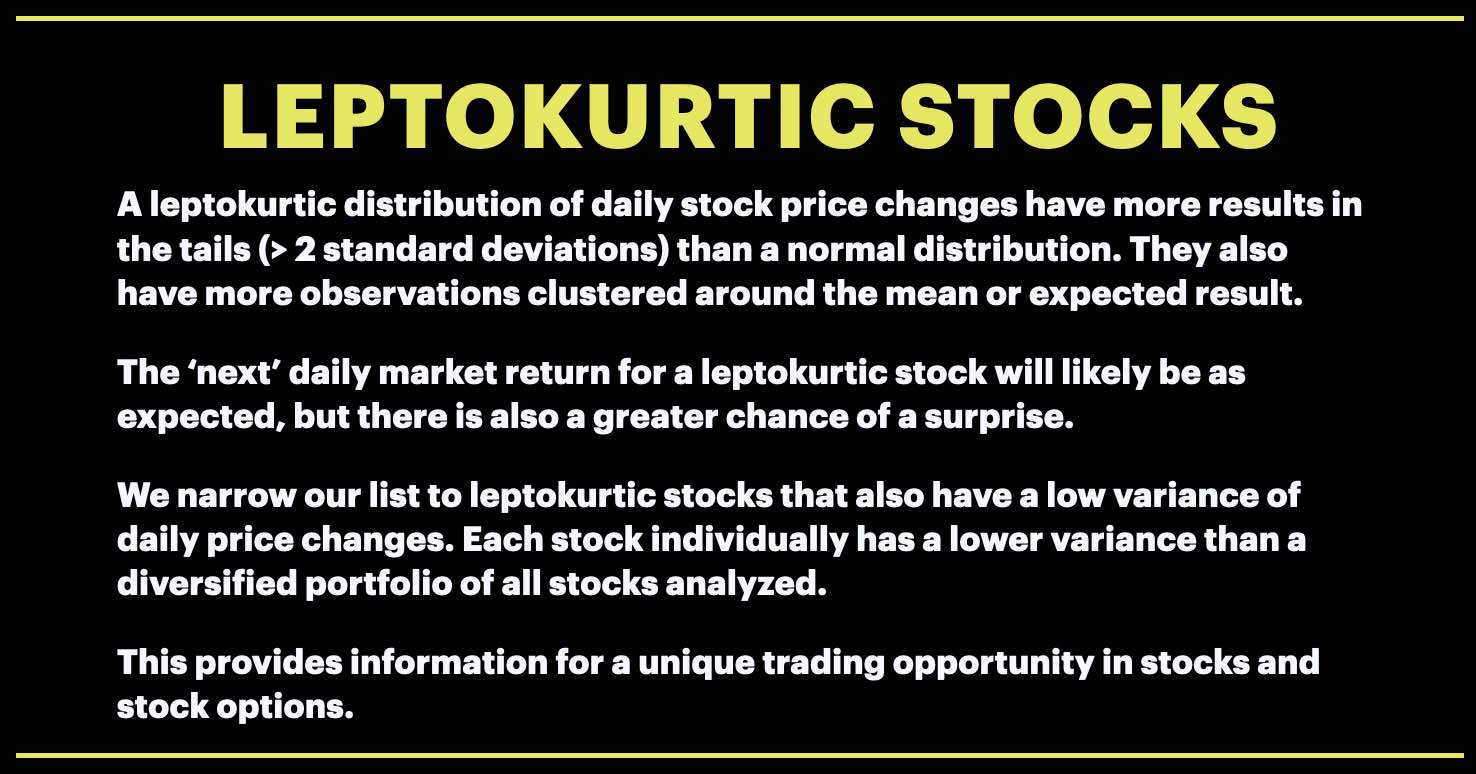
A leptokurtic distribution of daily stock price changes have more results in the tails (or > 2 standard deviations) than a normal distribution, and have a greater number of observations clustered tightly around the mean or expected result. This means the typical market return will be as expected more often than a normally distributed stock, and there is a greater chance of a big surprise move. We further narrow down the field of leptokurtic stocks by focusing on low variance stocks.
A leptokurtic distribution of daily stock price changes have more results in the tails (or > 2 standard deviations) than a normal distribution, and have a greater number of observations clustered tightly around the mean or expected result. This means the typical market return will be as expected more often than a normally distributed stock, and there is a greater chance of a big surprise move. We further narrow down the field of leptokurtic stocks by focusing on low variance stocks.
A short film to describe our service and current picks as of market close January 5, 2023