Advisory services: algorithmic and quantitative analysis on ~3,000 US-listed common stocks
Phone: (312) 515-7333 (Free consultation, call for an appointment)
- Our knowledge of the client
- Our skills and experience in the market
- Our proprietary, algorithmic, quantitative analysis of U.S. stocks
- Our analysis of macroeconomic top drivers that impact U.S. stocks.
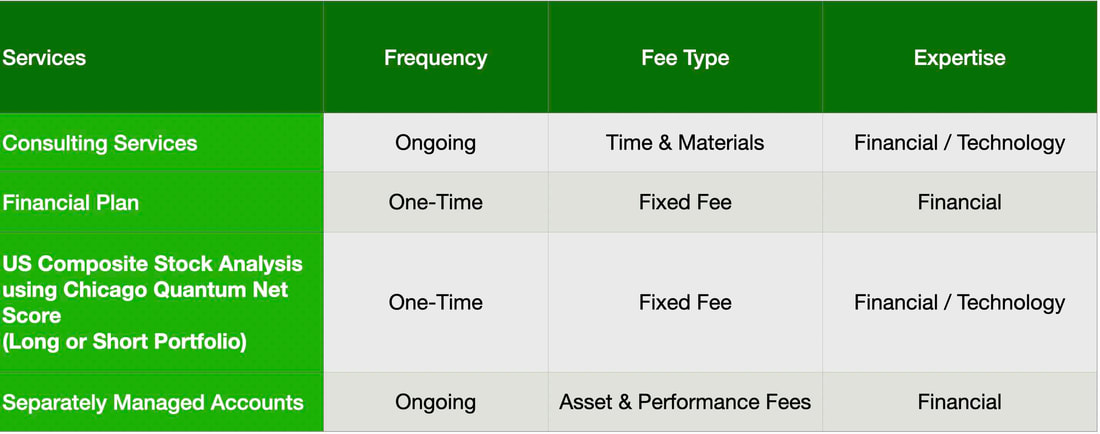
We earn fees in three ways:
- We provide investment planning
- We provide our Chicago Quantum Net Score analysis to clients (run daily)
- We provide customized IT, quantum and financial consulting services
- We manage client investments held at Charles Schwab, our custodial agent.
We are a non-discretionary investment advisor.
We do not sell products, nor earn commissions on investments.
We serve clients including institutional investors, high net-worth individuals (‘accredited’ investors), and financial services businesses. We do not serve retail investors.
Our research is based on a proprietary quantitative algorithm (derived from the Sharpe Ratio), analysis model and a high-performance platform that we run both classically and on quantum annealing computers. Our Chicago Quantum Net Score algorithm was originally designed to run on quantum computers.
Our primary service is a daily, comprehensive US-listed stock analysis
We score individual common stocks on multiple dimensions. Our main score is its efficiency, or how a stock’s expected return compares to its historical price volatility.
- A stock portfolio with minimum risk and maximum expected return is efficient. We believe investors prefer maximizing returns while minimizing risks and we work to identify efficient U.S. stock portfolios. These are long portfolios.
- A stock with maximum risk and minimum expected return is inefficient, and will likely have more chop or movement than overall direction. These stocks also tend to decline rapidly. Those are stocks to short.
- Anecdotally, we found these portfolios will sometimes move aggressively as the market detects and corrects these anomalies.
- We calculate fundamental measures like dividend yields, profitability, book value, net debt and AOCI for all stocks that pass data validation, and technical analysis measures like anomalous price distributions, significant volume and price spikes, and price volatility for the population. The combination of these metrics about a stock can inform an investor about a stock and help build a story to buy, sell, or avoid it.
- We assess skewness, kurtosis and beta for all stocks and identify stock anomalies, including negative beta stocks.
We create and test billions of multiple-stock portfolios, equally weighted, to find optimized portfolios which either maximize or minimize their efficiency. We create a theoretical stock portfolio search space of every combination of over 3,000 stocks that pass daily data validation (and base filters). This is data rich and computationally intensive (takes hours on our powerful server). Before we had a powerful server, we developed and executed our algorithm on a quantum computer. We retain the ability to re-run on D-Wave Systems quantum computers.
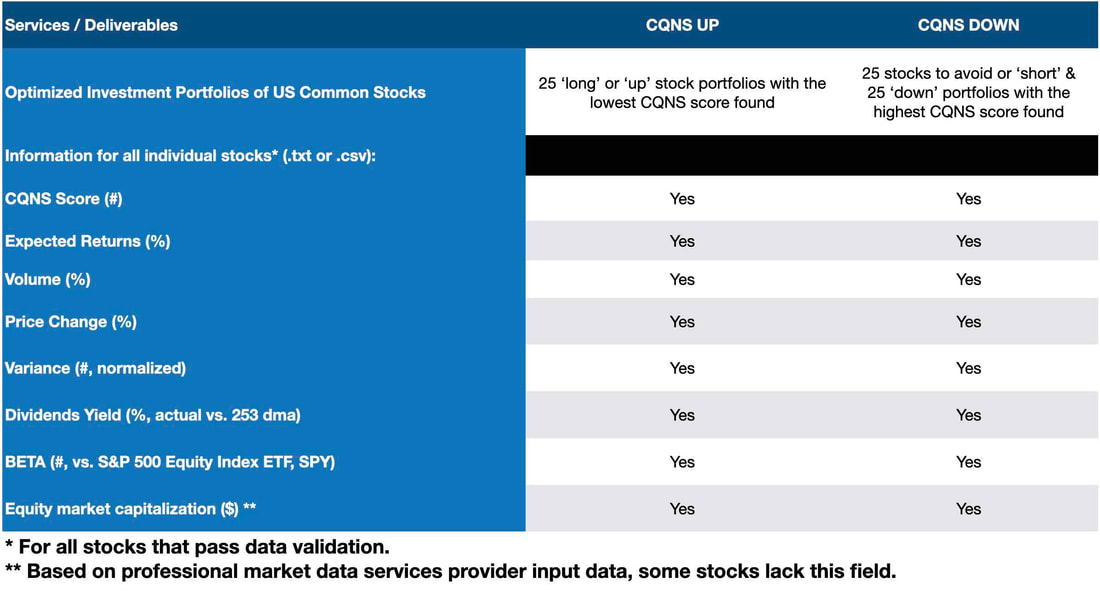
Our services are delivered via a written management report and spreadsheet of our analysis findings. They include the information contained in the two tables below.

Consulting Session for one hour
This is a one-hour meeting, remote or in-person, with Jeffrey Cohen, President of U.S. Advanced Computing Infrastructure, Inc.
- You choose the topic and deliverables.
- You may buy multiple hours to fund a project.
We believe management consulting is pursuing "the art of the possible." These are areas where we believe we may be helpful:
- We will discuss our research into the South China Sea
- We offer traditional IT management consulting services.
- We offer quantum computing consulting
- We offer financial investment analysis of stock portfolios based on our Chicago Quantum Net Score (read more in our published research). Today we run a model that analyzes ~3,000 U.S. listed equities and optimizes both 'long' and 'short' stock portfolios.
- Project and program management.
- Outsourcing advisory.
- We run your business problem on our discrete mathematical models (on our own server equipment using our own solvers).
- We may configure and run your problem on quantum annealing computers from D-Wave Systems Inc.
- We ALWAYS work confidentially, diligently, free of conflict of interest, and bring our best thinking and insights.
We can operate at both the strategic and tactical level depending on client need. This includes business strategy, business problem decomposition, mathematical and data design, algorithm design, and use of quantum and classical solvers. The President has a strategic perspective from ~ 30 years of executive corporate management in IT and professional services, and also rolls up his sleeves and codes when there is a good fit with the problem and his expertise.
Absolute discretion and professionalism is assured.
In closing
If you would prefer to discuss this 1:1 and negotiate a scope of work and level of effort, please contact us at [email protected] or call (312) 515-7333. We will develop a quotation and will invoice for our services.

US stock market analysis (LONG)
A comprehensive, quantitative analysis of the US stock market to find optimal portfolios.
It is performed daily after market close based on a year of historical data. It checks ~10,000 US tickers that traded that day, finds those that pass data validation (~3,000), then searches through potential U.S. equity portfolio combinations to find optimal US-listed common stock portfolios.
We run the analysis on our in-house platform using data provided by Intrinio, our premium, market data services provider. Once complete, we review and send you a report and data files.
Our model finds the U.S. common stock portfolio with the largest net difference between expected returns and historical risk, on a normalized basis (equalize the units, then subtract the values). This finds portfolios with the largest difference between historical risk and expected returns (using BETA values calculated using the S&P 500 Equity Index ETF, applied against historical U.S. stock market returns and current risk-free interest rates).
For more information on the math and logic, we released the Chicago Quantum Net Score into the academic domain via via three arXiv pre-print articles that have been cited numerous times in other academic works.
We provide clients with the top 25 U.S. equity portfolios in order of their Chicago Quantum Net Score. We also provide a spreadsheet with summary statistics, in order of their individual Chicago Quantum Net Score, for all stocks that pass data validation.
We provide numerous descriptive statistics about the stocks we analyze that are produced by our model and highlight non-normal distributions we find interesting.
How does this work for investors?
Optimized portfolios near the top of the list may outperform the US equity market by having lower price volatility and higher expected returns because it attracts investor attention and investment. Optimized at portfolio should advance aggressively and with less volatility as markets advance. We have seen significant investor attention and volume in stocks at or near the top of our Chicago Quantum Net Score stocks. Anecdotal evidence suggests that this model currently works. The stocks at the top of the list are doing well, stocks rising towards to top of the list do well, and many of these stocks have risen (and fallen) aggressively as they trend higher.
In our managed separate accounts offering based on this model, we typically hedge against market declines as markets do not move in a single direction.
Clients may suggest change requests to evolve our analysis.
What you receive:
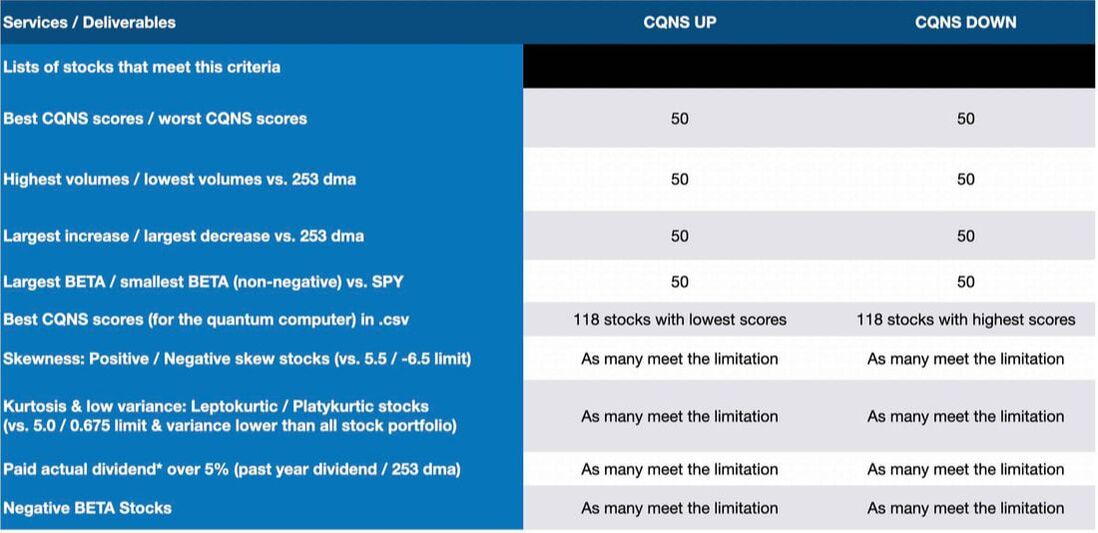
A system generated output text report, containing the results of the analysis, including the 25 most optimized U.S. common stock portfolios we found that day. The report includes the following:
- Market index variance
- Expected market return to risk, and risk-free rate
- Calibration: Normalizing our 'all stock portfolio' and what it looks like.
- 25 stocks with the best CQNS scores
- 25 stocks with the worst CQNS scores
- 25 stocks with the highest relative volume vs. 253 day average
- 25 stocks with the lowest relative volume
- 25 stocks with the largest increases in stock price
- 25 stocks with the largest decrease in stock price
- 25 stocks with the largest BETA
- 25 stocks with the smallest, positive BETA
- All stocks with excessive positive skewness
- All stocks with excessive negative skewness
- All stocks that are extremely leptokurtic and have low variance
- All stocks that are extremely platykurtic and have low variance
- 25 optimized portfolios (in order of CQNS)
- All stocks that passed data validation, in order of CQNS score, with the following values:
- Rank (integer)
- Ticker (text)
- Company Name (text)
- CQNS Score (decimal)
- Expected Return (%)
- Actual Dividend Yield (1 + % yield)
- BETA (decimal)
- Market Capitalization (equity, $)
- All stocks that paid 7% or more in dividends or distributions in the past year
- All stocks with negative BETA (this list may contain select ETFs)
A spreadsheet with individual, descriptive metrics on each stock that passed data validation, including individual Chicago Quantum Net Scores. The spreadsheet contains a row for each stock including:
- Company ticker and name
- CQNS ranking & score (a decimal value)
- Expected returns (% for next year)
- Volume for each stock (% prior year average)
- Price Change (% prior year average)
- Stock variance (one year actual, normalized to allow comparison)
- Dividends paid (% prior year average price)
- BETA (vs. SPY, daily over one year)
- Equity market capitalization ($)
We are considering to add new statistics we use such as skewness and kurtosis. Please let us know your preferences for future runs.
Timing:
We run our analysis each night after 6pm ET to ensure complete trading day information, and will send you the report and spreadsheet once completed.
What you do:
You provide us with the following information as you place your order:
- Your name, physical address, email address & phone number
- Any special requests, instructions, or actionable objectives
- How you would like to receive your report and spreadsheet (if not by email). We use Google Drive, Slack, Whatsapp, Microsoft Teams/Office, and other collaboration technologies.
You may also call or email us with your information.
- Email: [email protected]
- Cell: +1.312.515.7333
Please pay at the time of online order. You may request and pay based on an invoice. We accept payment via cash, check, ACH, or through online payment processor.
- We will never sell, nor use your personal information.
- We will only share your information if legally required. We request your physical address for FINRA/U.S. S.E.C./State reporting purposes.
Thank you for your order and your business.

US stock market analysis (SHORT)
This service is a comprehensive analysis of the US stock market to find a portfolio of stocks to short or avoid in your portfolio. It is performed after market close. It checks ~10,000 US tickers that trade, finds those that pass data validation (~3,000 currently), then it searches within a very great many U.S. stock portfolio combinations to find the optimal US-listed common stock portfolio to avoid, or short.
It takes us a few hours to run the analysis on our powerful in-house server using our proprietary software platform and code, accessing a full set of premium, market data services from Intrinio with every run.
Finally, we then spend a few minutes reviewing the results and pulling them together into an email or data drop for you.
The optimal "DOWN or SHORT" US-listed common stock portfolio is one with the largest net historical risk less expected future return. It should perform worse than a passive US equity index fund such as the famous 500, technology 100 or small cap 2000.
We invented the Chicago Quantum Net Score and wrote the code to determine the best way to do this. We released the ideas into the public domain before COVID via three arXiv articles and have been cited numerous times in other academic works. The logic still holds.
We don't like the idea of giving a potential investor only one option as it could cause crowding into a specific portfolio. Therefore, we give clients the top 25 portfolios in order of their Chicago Quantum Net Score. We also provide a spreadsheet with summary statistics for all stocks that passed data validation.
We also provide other interesting statistics about the stocks we analyzed that are produced by our model (see list).
How does this work for investors?
The optimal "DOWN" portfolio, if things continue as they were, is expected to underperform the US equity market by having higher price volatility and lower expected returns. That should result in a portfolio that moves erratically but does not advance quickly and steadily when markets advance.
What we found anecdotally is that these stocks are often MEME stocks or move very quickly without a true sense of direction. They often seem like 'scam' stocks. They are very risky stocks to hold, and tend to fall in price.
This portfolio can be used as a hedge for long US stock portfolios to protect against downside market risk. We did that when we ran our portfolio simulation for our separately managed accounts. We hedged the optimal long portfolio with the optimal short portfolio since that made the most logical sense to us.
By way of a proof point, we have run A/B analysis of profitable and unprofitable company stocks. Unprofitable company stocks tend to have far higher price volatility. Couple that with a company that is not 'going anywhere' and you can start to build a picture. With supporting fundamental analysis, you can select short stocks with significantly negative net income, negative book value, and debt to really drive poor stock performance.
If you become a repeat client, you can ask us to customize things.
What you receive:
A set of 25 optimized stock portfolios that are the most inefficient, and have the worst risk-return trade-off, along with their portfolio CQNS score. This allows our clients to tailor their holdings with known impacts to their mathematical advantage over a passive US equity index.
These tend to be very small portfolios of one to three stocks, because diversification improves them too much. When we used this analysis for our separate managed accounts simulation, we only had three short stocks at a time. A client can pick a few short names from the ordered list of stocks and usually back up the quantitative analysis with supporting fundamental analysis.
In addition to finding and providing a set of optimized stock portfolios by CQNS score, we provide additional analytical deliverables, as follows:
For each stock that passed data validation, over the past 253 trading days:
- CQNS score for each stock
- Volume for each stock (% prior year average)
- Price Change (% prior year average)
- BETA (vs. SPY)
- Dividends paid (% prior year average price)
- Expected returns (% for next year)
- Equity market capitalization ($)
- Stock variance for each stock, normalized to allow comparison.
For stocks that beat a threshold value over the past 253 trading days:
- Non-normal distributions in fourth-order price distribution (kurtosis) and low daily price variance
- Non-normal distributions in the third-order price distribution (skewness)
- Stocks with negative, high, or low BETA values (BETA vs. SPY).
- Stocks with large price changes (% of average)
- Stocks with volume spikes (# of days volume)
Timing:
Once we see that you purchased the service, we initiate the analysis after 7pm ET to ensure complete trading day information.
We email, upload or file transfer to you the model output in a text file with a spreadsheet (.CSV) before the next market open, and sometimes before midnight ET.
What you do:
- You provide us with the following information as you place your order:Your name, physical address, email address & phone number
- Any special requests, instructions, or actionable objectives
- How you would like to receive your report and spreadsheet (if not by email). We use Google Drive, Slack, Microsoft Teams/Office, and other collaboration technologies.
- You may also call or email us with your information.Email: [email protected]
- Cell: +1.312.515.7333
For repeat orders, you may request an invoice. We accept payment via check, ACH, or through an online payment processor (secure).
We will not sell or share your information unless legally required.
Thank you for your order and your business.

Investment Planning Workshop
We will spend time to understand your investing experience, your degree of risk aversion, your needs and wants for future income, and any special circumstances relevant to your investments.
We run a Chicago Quantum Net Score analysis for the client in advance of the workshop. If relevant to the discussion, we will present those findings.
This service consists of multiple calls and meetings, document and account reviews, a live workshop to discuss potential strategies and options, time to document, analyze and conclude with an investment strategy. We include time for open discussion and to answer client questions.
By the end of the workshop, and through the development of the investment plan, we have built a better understanding of your situation and found a mix of investment options, including stock portfolios that may be attractive (either long or short).
The client benefits from a better understanding of their financial situation, any gaps between their investments and their investment strategy, and (hopefully) has increased their financial literacy with a trusted service provider.
The workshop portion of the service is intended to be delivered onsite with the client. It can also be spread over two days to accommodate schedules.
This includes up to 15 hours of work from our Investment Advisor Representative over a one-week period.

ToughBuilt Industries Stock Price Valuation & Analysis
We will discuss our due diligence performed on this stock, which consists of open source intelligence gathering, discussions with Investor Relations, their Auditor and NASDAQ. We will review recent press releases and SEC filings and our take on the company's progress towards profitability.
We will discuss our current spreadsheet with the valuation of ToughBuilt Industries common stock.
We will not share any non-public or confidential information.
We hope to have an interesting, insightful, well informed and enjoyable conversation with you about the company and its stock.
- We created a repeatable, scalable analytic service that we have run, analyzed and improved over the past three years. We have tracked performance and tested alternative hypotheses. We keep growing our data input sizes and platform effectiveness. We learn from our successes and our failures. We grow our expertise in the US equities markets.
- This algorithm is free from emotion. This is a fact-based analysis, run repeatedly. The stocks selected change over time. We believe the underlying 'math' in the market creates creates consistently high-performing, or very low performing US-listed stock portfolios.
- This is a proprietary algorithm run on an in-house technology platform that uses professional market data services. You receive the benefit of those investments, expenses, intuition, additional research and expertise.
- We discuss our approach, methodology, findings and recommendations in detail. We conduct customized research.
- We conduct quantitative macro-economic and monetary policy discussions with clients to share 'big picture' ideas.
- We provide client-directed research and analysis of companies, industries or economies.
Consulting Session for one hour
This is a one-hour meeting, remote or in-person, with Jeffrey Cohen, President of U.S. Advanced Computing Infrastructure, Inc.
- You choose the topic and deliverables.
- You may buy multiple hours to fund a project.
We believe management consulting is pursuing "the art of the possible." These are areas where we believe we may be helpful:
- We will discuss our research into the South China Sea
- We offer traditional IT management consulting services.
- We offer quantum computing consulting
- We offer financial investment analysis of stock portfolios based on our Chicago Quantum Net Score (read more in our published research). Today we run a model that analyzes ~3,000 U.S. listed equities and optimizes both 'long' and 'short' stock portfolios.
- Project and program management.
- Outsourcing advisory.
- We run your business problem on our discrete mathematical models (on our own server equipment using our own solvers).
- We may configure and run your problem on quantum annealing computers from D-Wave Systems Inc.
- We ALWAYS work confidentially, diligently, free of conflict of interest, and bring our best thinking and insights.
We can operate at both the strategic and tactical level depending on client need. This includes business strategy, business problem decomposition, mathematical and data design, algorithm design, and use of quantum and classical solvers. The President has a strategic perspective from ~ 30 years of executive corporate management in IT and professional services, and also rolls up his sleeves and codes when there is a good fit with the problem and his expertise.
Absolute discretion and professionalism is assured.
In closing
If you would prefer to discuss this 1:1 and negotiate a scope of work and level of effort, please contact us at [email protected] or call (312) 515-7333. We will develop a quotation and will invoice for our services.
Investment Planning Workshop
We will spend time to understand your investing experience, your degree of risk aversion, your needs and wants for future income, and any special circumstances relevant to your investments.
We run a Chicago Quantum Net Score analysis for the client in advance of the workshop. If relevant to the discussion, we will present those findings.
This service consists of multiple calls and meetings, document and account reviews, a live workshop to discuss potential strategies and options, time to document, analyze and conclude with an investment strategy. We include time for open discussion and to answer client questions.
By the end of the workshop, and through the development of the investment plan, we have built a better understanding of your situation and found a mix of investment options, including stock portfolios that may be attractive (either long or short).
The client benefits from a better understanding of their financial situation, any gaps between their investments and their investment strategy, and (hopefully) has increased their financial literacy with a trusted service provider.
The workshop portion of the service is intended to be delivered onsite with the client. It can also be spread over two days to accommodate schedules.
This includes up to 15 hours of work from our Investment Advisor Representative over a one-week period.