
US stock market analysis (LONG)
A comprehensive, quantitative analysis of the US stock market to find optimal portfolios.
It is performed daily after market close based on a year of historical data. It checks ~10,000 US tickers that traded that day, finds those that pass data validation (~3,000), then searches through potential U.S. equity portfolio combinations to find optimal US-listed common stock portfolios.
We run the analysis on our in-house platform using data provided by Intrinio, our premium, market data services provider. Once complete, we review and send you a report and data files.
Our model finds the U.S. common stock portfolio with the largest net difference between expected returns and historical risk, on a normalized basis (equalize the units, then subtract the values). This finds portfolios with the largest difference between historical risk and expected returns (using BETA values calculated using the S&P 500 Equity Index ETF, applied against historical U.S. stock market returns and current risk-free interest rates).
For more information on the math and logic, we released the Chicago Quantum Net Score into the academic domain via via three arXiv pre-print articles that have been cited numerous times in other academic works.
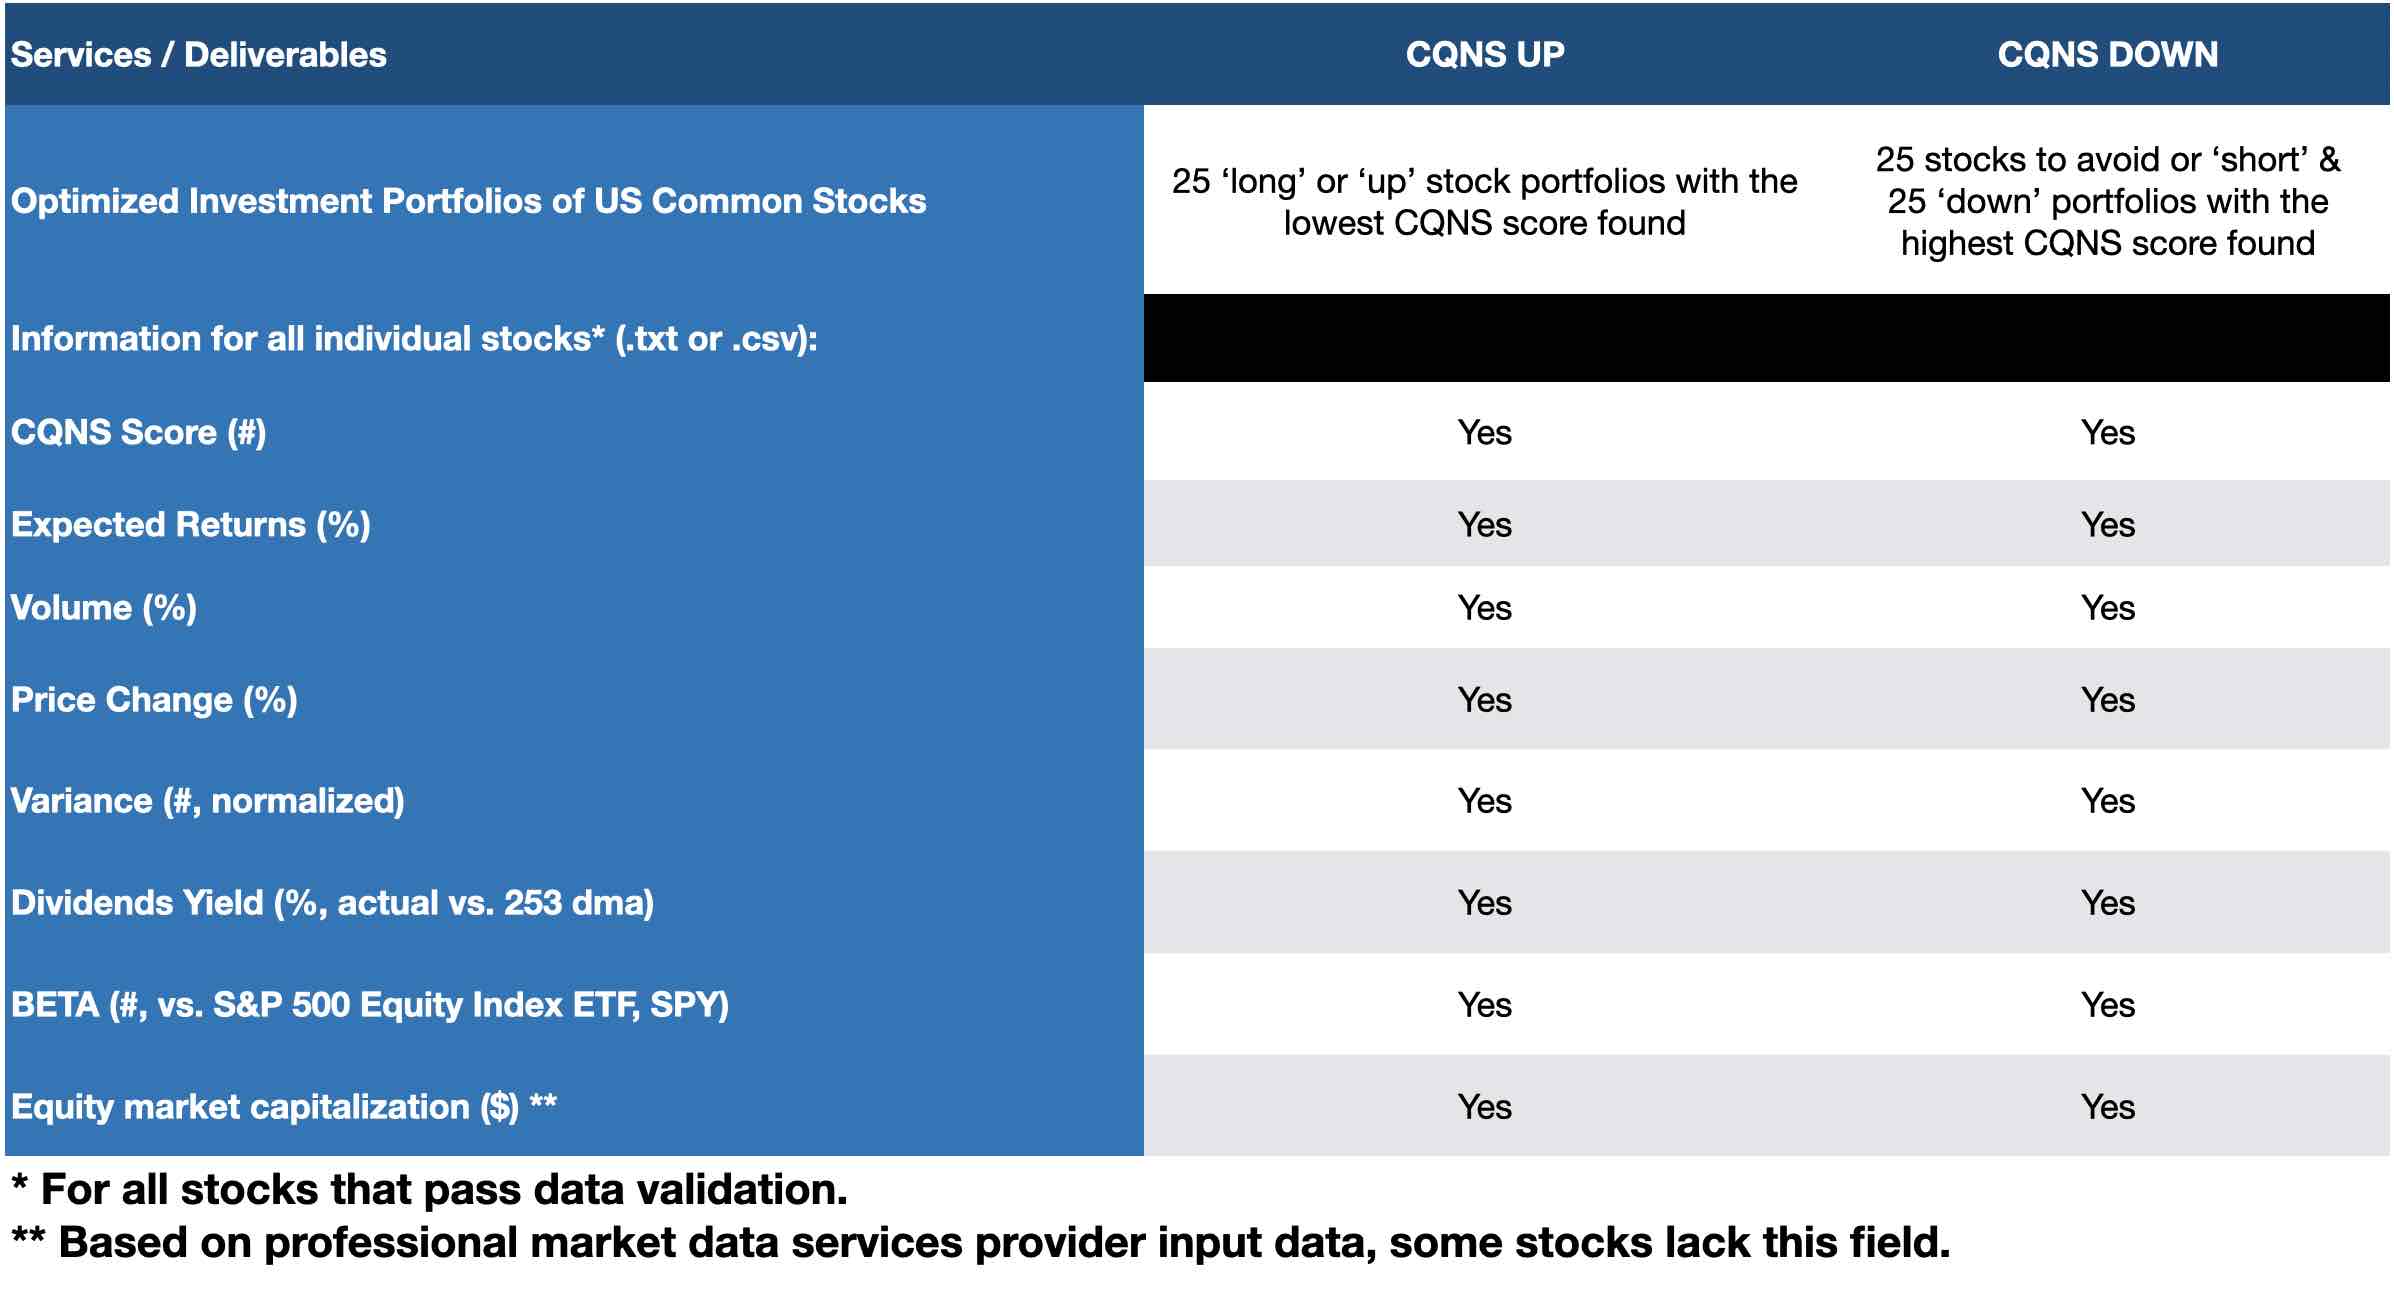
We provide clients with the top 25 U.S. equity portfolios in order of their Chicago Quantum Net Score. We also provide a spreadsheet with summary statistics, in order of their individual Chicago Quantum Net Score, for all stocks that pass data validation.
We provide numerous descriptive statistics about the stocks we analyze that are produced by our model and highlight non-normal distributions we find interesting.
How does this work for investors?
Optimized portfolios near the top of the list may outperform the US equity market by having lower price volatility and higher expected returns because it attracts investor attention and investment. Optimized at portfolio should advance aggressively and with less volatility as markets advance. We have seen significant investor attention and volume in stocks at or near the top of our Chicago Quantum Net Score stocks. Anecdotal evidence suggests that this model currently works. The stocks at the top of the list are doing well, stocks rising towards to top of the list do well, and many of these stocks have risen (and fallen) aggressively as they trend higher.
In our managed separate accounts offering based on this model, we typically hedge against market declines as markets do not move in a single direction.
Clients may suggest change requests to evolve our analysis.
What you receive:
A system generated output text report, containing the results of the analysis, including the 25 most optimized U.S. common stock portfolios we found that day. The report includes the following:
- Market index variance
- Expected market return to risk, and risk-free rate
- Calibration: Normalizing our 'all stock portfolio' and what it looks like.
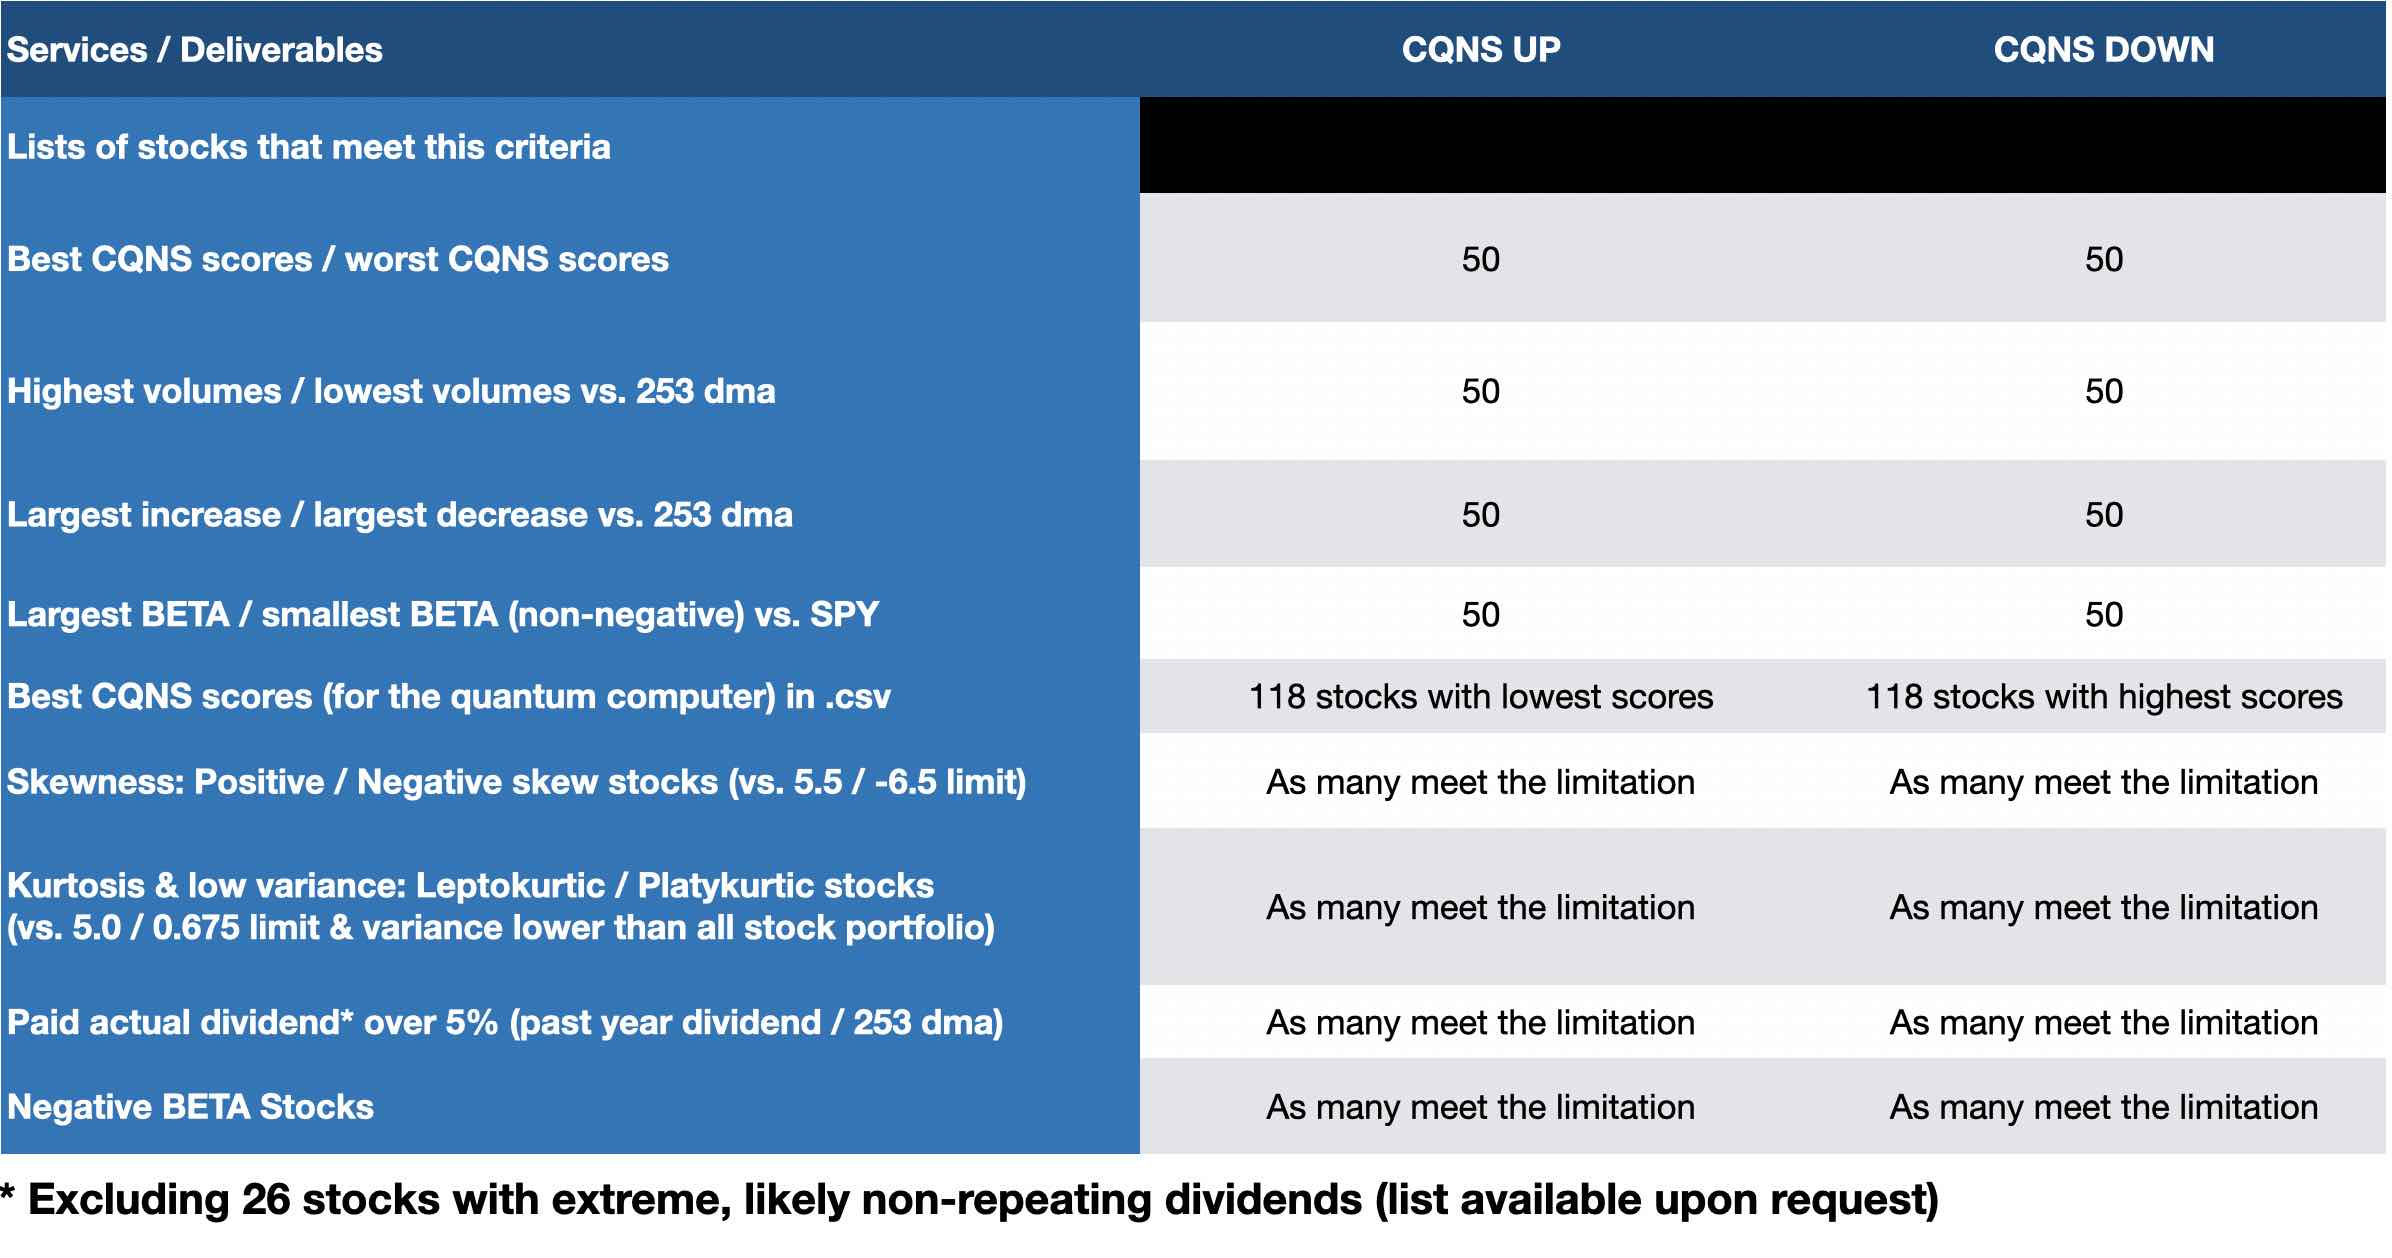
- 25 stocks with the best CQNS scores
- 25 stocks with the worst CQNS scores
- 25 stocks with the highest relative volume vs. 253 day average
- 25 stocks with the lowest relative volume
- 25 stocks with the largest increases in stock price
- 25 stocks with the largest decrease in stock price
- 25 stocks with the largest BETA
- 25 stocks with the smallest, positive BETA
- All stocks with excessive positive skewness
- All stocks with excessive negative skewness
- All stocks that are extremely leptokurtic and have low variance
- All stocks that are extremely platykurtic and have low variance
- 25 optimized portfolios (in order of CQNS)
- All stocks that passed data validation, in order of CQNS score, with the following values:
- Rank (integer)
- Ticker (text)
- Company Name (text)
- CQNS Score (decimal)
- Expected Return (%)
- Actual Dividend Yield (1 + % yield)
- BETA (decimal)
- Market Capitalization (equity, $)
- All stocks that paid 7% or more in dividends or distributions in the past year
- All stocks with negative BETA (this list may contain select ETFs)
A spreadsheet with individual, descriptive metrics on each stock that passed data validation, including individual Chicago Quantum Net Scores. The spreadsheet contains a row for each stock including:
- Company ticker and name
- CQNS ranking & score (a decimal value)
- Expected returns (% for next year)
- Volume for each stock (% prior year average)
- Price Change (% prior year average)
- Stock variance (one year actual, normalized to allow comparison)
- Dividends paid (% prior year average price)
- BETA (vs. SPY, daily over one year)
- Equity market capitalization ($)
We are considering to add new statistics we use such as skewness and kurtosis. Please let us know your preferences for future runs.
Timing:
We run our analysis each night after 6pm ET to ensure complete trading day information, and will send you the report and spreadsheet once completed.
What you do:
You provide us with the following information as you place your order:
- Your name, physical address, email address & phone number
- Any special requests, instructions, or actionable objectives
- How you would like to receive your report and spreadsheet (if not by email). We use Google Drive, Slack, Whatsapp, Microsoft Teams/Office, and other collaboration technologies.
You may also call or email us with your information.
- Email: [email protected]
- Cell: +1.312.515.7333
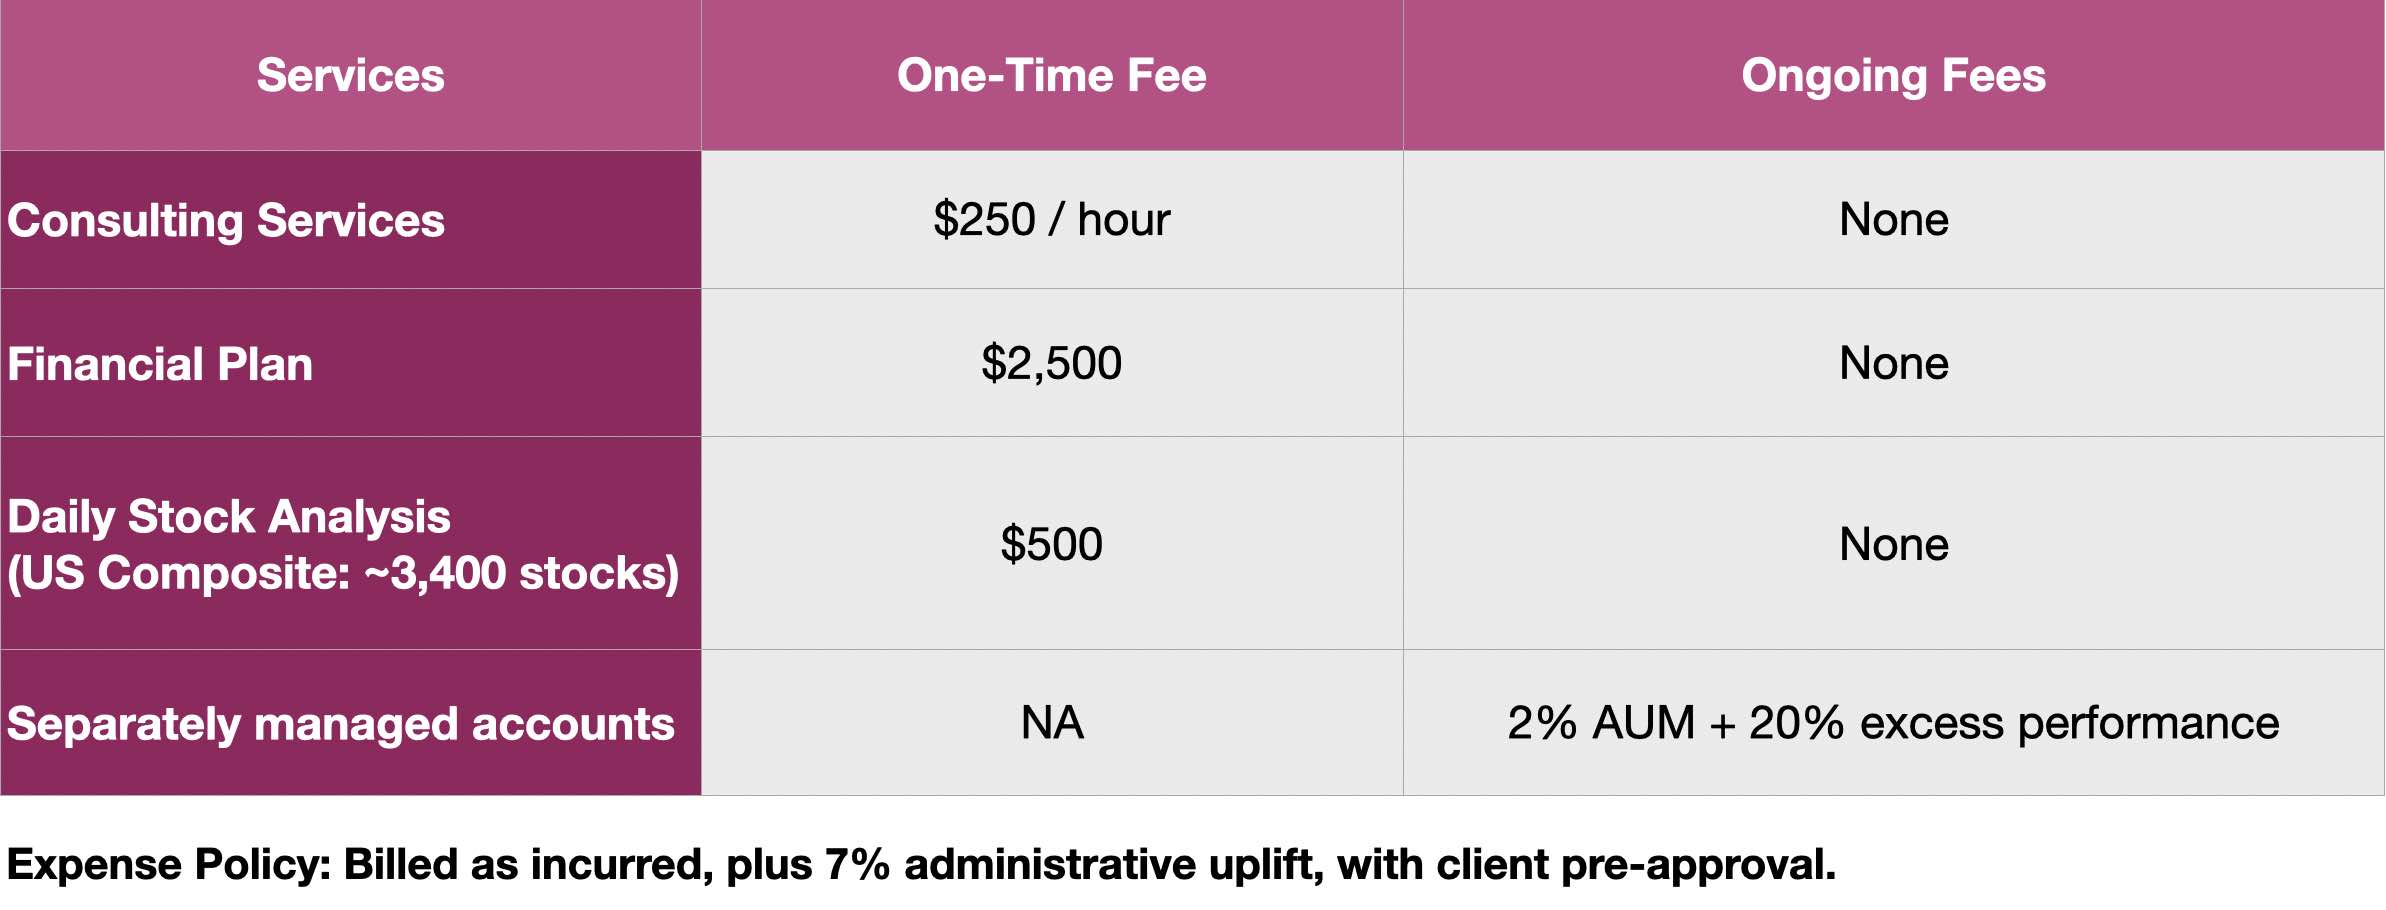
Please pay at the time of online order. You may request and pay based on an invoice. We accept payment via cash, check, ACH, or through online payment processor.
- We will never sell, nor use your personal information.
- We will only share your information if legally required. We request your physical address for FINRA/U.S. S.E.C./State reporting purposes.
Thank you for your order and your business.
Comprehensive US stock market analysis (UP)
Our algorithm, platform and methods are subject to change and continued development. Please perform your own due diligence and research into companies before investing. Investments in equities can and do lose money. We do not guarantee your results.
Explanations:
Please see our webpage "Market Questions & Data" for further details, and our homepage for our brochure.
How we perform the analysis:
We start with a list of every US listed ticker that traded that day. We perform data analysis and validation to find a set of profitable US listed common stocks that meet our data validation criteria. We filter out stocks with negative net income, equity market capitalization below a floor level (e.g., $100M), and stocks with negative BETA.
We run our proprietary, quantitative analysis on professionally-sourced market data from Intrinio on our platform after market close for the date purchased. We write the management report sharing the results of the 'run' and our observations.
We guarantee that we will email your report before the next market open or your analysis is free.
The following video shows how you might use the model output to build your own individualized CQNS fund.