

US stock market analysis (SHORT)
This service is a comprehensive analysis of the US stock market to find a portfolio of stocks to short or avoid in your portfolio. It is performed after market close. It checks ~10,000 US tickers that trade, finds those that pass data validation (~3,000 currently), then it searches within a very great many U.S. stock portfolio combinations to find the optimal US-listed common stock portfolio to avoid, or short.
It takes us a few hours to run the analysis on our powerful in-house server using our proprietary software platform and code, accessing a full set of premium, market data services from Intrinio with every run.
Finally, we then spend a few minutes reviewing the results and pulling them together into an email or data drop for you.
The optimal "DOWN or SHORT" US-listed common stock portfolio is one with the largest net historical risk less expected future return. It should perform worse than a passive US equity index fund such as the famous 500, technology 100 or small cap 2000.
We invented the Chicago Quantum Net Score and wrote the code to determine the best way to do this. We released the ideas into the public domain before COVID via three arXiv articles and have been cited numerous times in other academic works. The logic still holds.
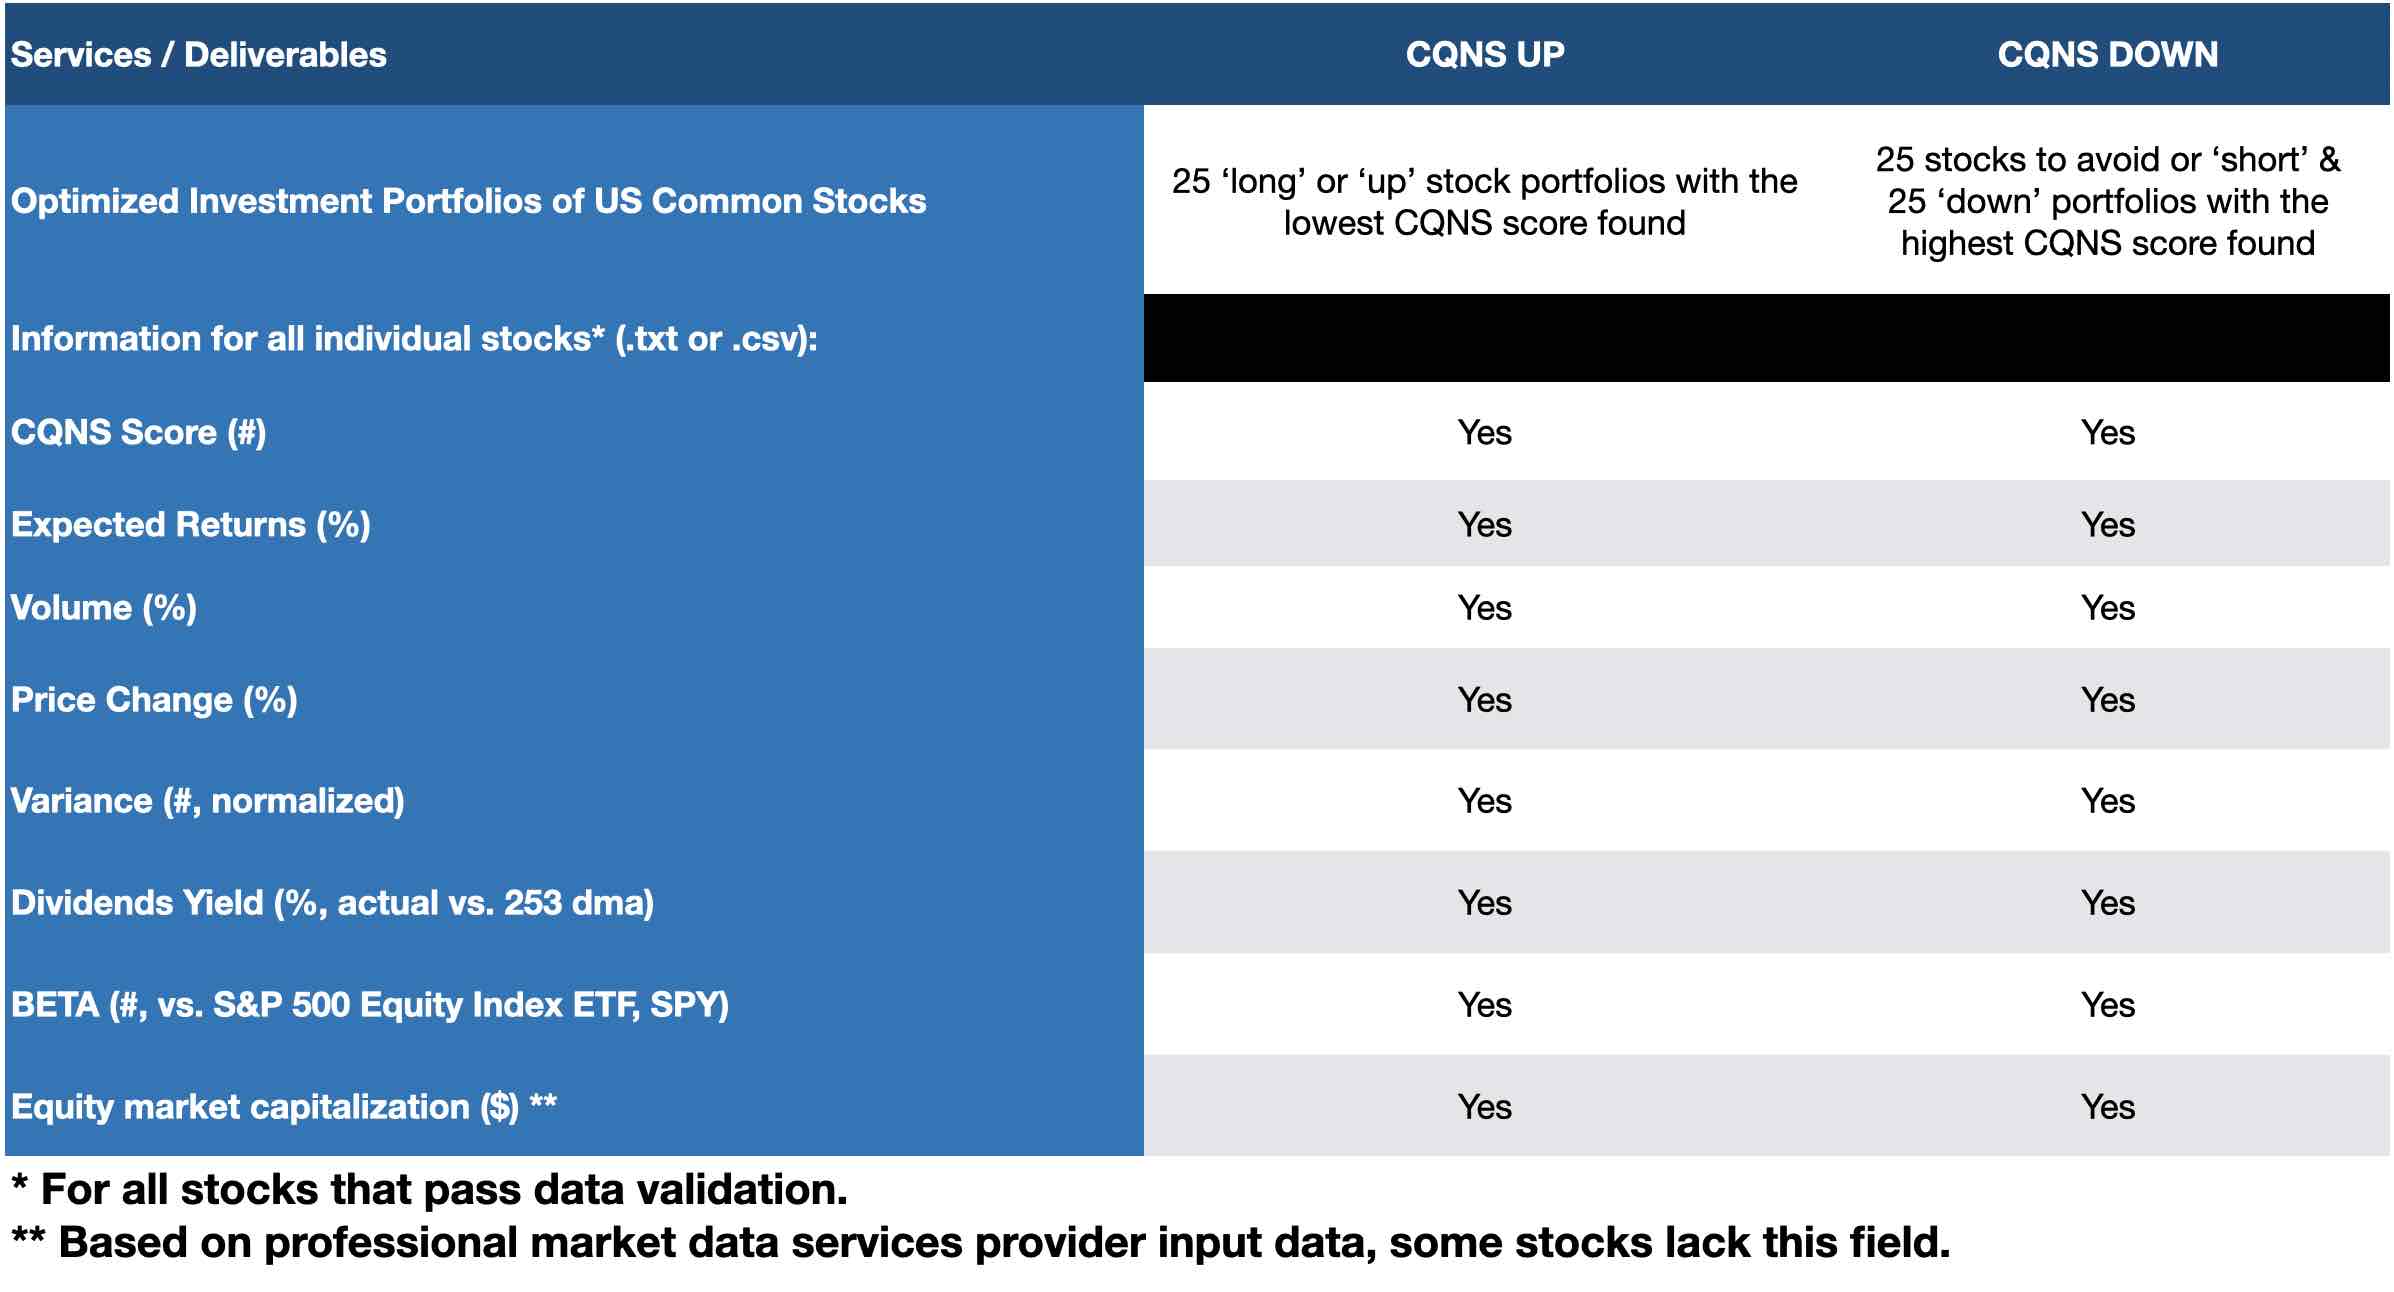
We don't like the idea of giving a potential investor only one option as it could cause crowding into a specific portfolio. Therefore, we give clients the top 25 portfolios in order of their Chicago Quantum Net Score. We also provide a spreadsheet with summary statistics for all stocks that passed data validation.
We also provide other interesting statistics about the stocks we analyzed that are produced by our model (see list).
How does this work for investors?
The optimal "DOWN" portfolio, if things continue as they were, is expected to underperform the US equity market by having higher price volatility and lower expected returns. That should result in a portfolio that moves erratically but does not advance quickly and steadily when markets advance.
What we found anecdotally is that these stocks are often MEME stocks or move very quickly without a true sense of direction. They often seem like 'scam' stocks. They are very risky stocks to hold, and tend to fall in price.
This portfolio can be used as a hedge for long US stock portfolios to protect against downside market risk. We did that when we ran our portfolio simulation for our separately managed accounts. We hedged the optimal long portfolio with the optimal short portfolio since that made the most logical sense to us.
By way of a proof point, we have run A/B analysis of profitable and unprofitable company stocks. Unprofitable company stocks tend to have far higher price volatility. Couple that with a company that is not 'going anywhere' and you can start to build a picture. With supporting fundamental analysis, you can select short stocks with significantly negative net income, negative book value, and debt to really drive poor stock performance.
If you become a repeat client, you can ask us to customize things.
What you receive:
A set of 25 optimized stock portfolios that are the most inefficient, and have the worst risk-return trade-off, along with their portfolio CQNS score. This allows our clients to tailor their holdings with known impacts to their mathematical advantage over a passive US equity index.
These tend to be very small portfolios of one to three stocks, because diversification improves them too much. When we used this analysis for our separate managed accounts simulation, we only had three short stocks at a time. A client can pick a few short names from the ordered list of stocks and usually back up the quantitative analysis with supporting fundamental analysis.
In addition to finding and providing a set of optimized stock portfolios by CQNS score, we provide additional analytical deliverables, as follows:
For each stock that passed data validation, over the past 253 trading days:
- CQNS score for each stock
- Volume for each stock (% prior year average)
- Price Change (% prior year average)
- BETA (vs. SPY)
- Dividends paid (% prior year average price)
- Expected returns (% for next year)
- Equity market capitalization ($)
- Stock variance for each stock, normalized to allow comparison.
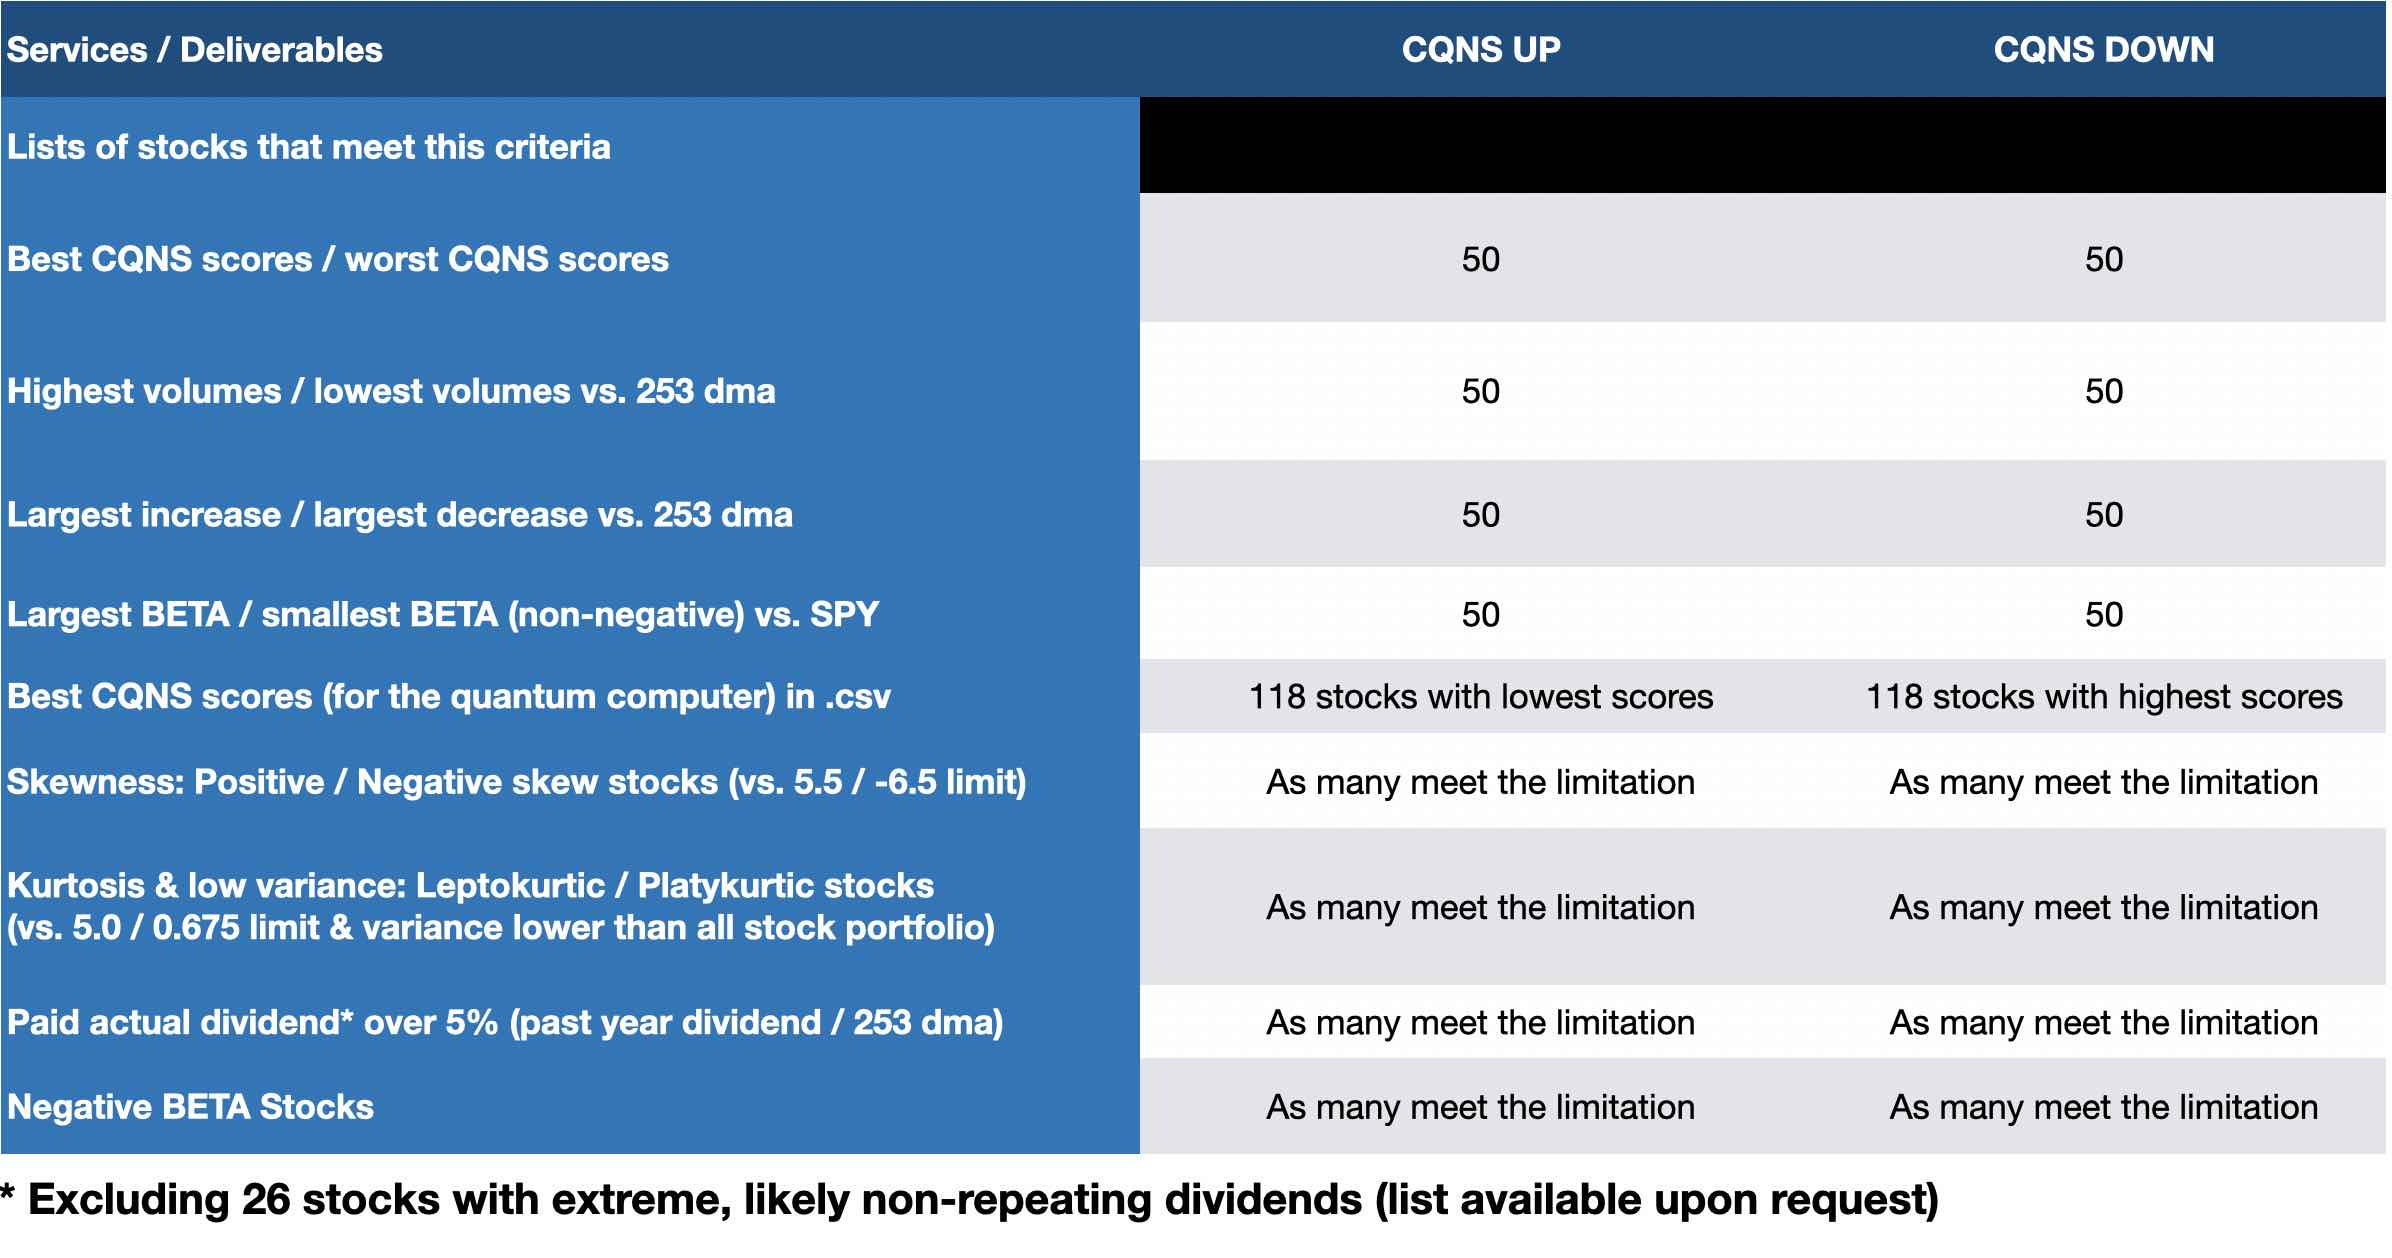
For stocks that beat a threshold value over the past 253 trading days:
- Non-normal distributions in fourth-order price distribution (kurtosis) and low daily price variance
- Non-normal distributions in the third-order price distribution (skewness)
- Stocks with negative, high, or low BETA values (BETA vs. SPY).
- Stocks with large price changes (% of average)
- Stocks with volume spikes (# of days volume)
Timing:
Once we see that you purchased the service, we initiate the analysis after 7pm ET to ensure complete trading day information.
We email, upload or file transfer to you the model output in a text file with a spreadsheet (.CSV) before the next market open, and sometimes before midnight ET.
What you do:
- You provide us with the following information as you place your order:Your name, physical address, email address & phone number
- Any special requests, instructions, or actionable objectives
- How you would like to receive your report and spreadsheet (if not by email). We use Google Drive, Slack, Microsoft Teams/Office, and other collaboration technologies.
- You may also call or email us with your information.Email: [email protected]
- Cell: +1.312.515.7333
For repeat orders, you may request an invoice. We accept payment via check, ACH, or through an online payment processor (secure).
We will not sell or share your information unless legally required.
Thank you for your order and your business.
Comprehensive US stock market analysis (DOWN)
Please see our homepage for our brochure and our webpage "Market Questions & Data" for further details.
Disclosure:
Our algorithm, platform and methods are subject to change and continued development. Please perform your own due diligence and research into companies before investing. Investments in equities can and do lose money. We do not guarantee your results.
How we perform the analysis:
We start with all 11,000+ US listed tickers that traded that day and perform data analysis and validation. We then run our quantitative analysis using professionally-sourced market data from Intrinio on our platform after market close for the date purchased. We write the management report sharing the results and our observations once the 'run' is completed.
We guarantee that we will email your report before the next market open or your analysis is free.