|
Good morning and happy President's Day in the USA. We notice that the number of advances and declines has been almost equal the last few times we looked at Corporate Bond price changes. Note in the chart below that for every 100 declines in bond prices (where yields rise), there were 101 advancers. It is hard to get more even than that. Into the details, you can see that high-yield bonds declined and convertible bonds declined, which reflects a weakening of expected returns to equity, and equity-like bond structures. We see that in our model run too. Investment grade bonds have outperformed, which reflects a 'flight to quality and low risk assets' that we have also seen in our model run. Why would bonds be flat? A few price patterns have stabilized in the short term when we have checked them (not all the time, ad-hoc review only): interest rates have stabilized, along with credit quality and the overall economy seems to be stabilizing. US Treasury Bonds are trading in a range too. Good luck in the markets. Jeffrey Cohen, President, US Advanced Computing Infrastructure, Inc. 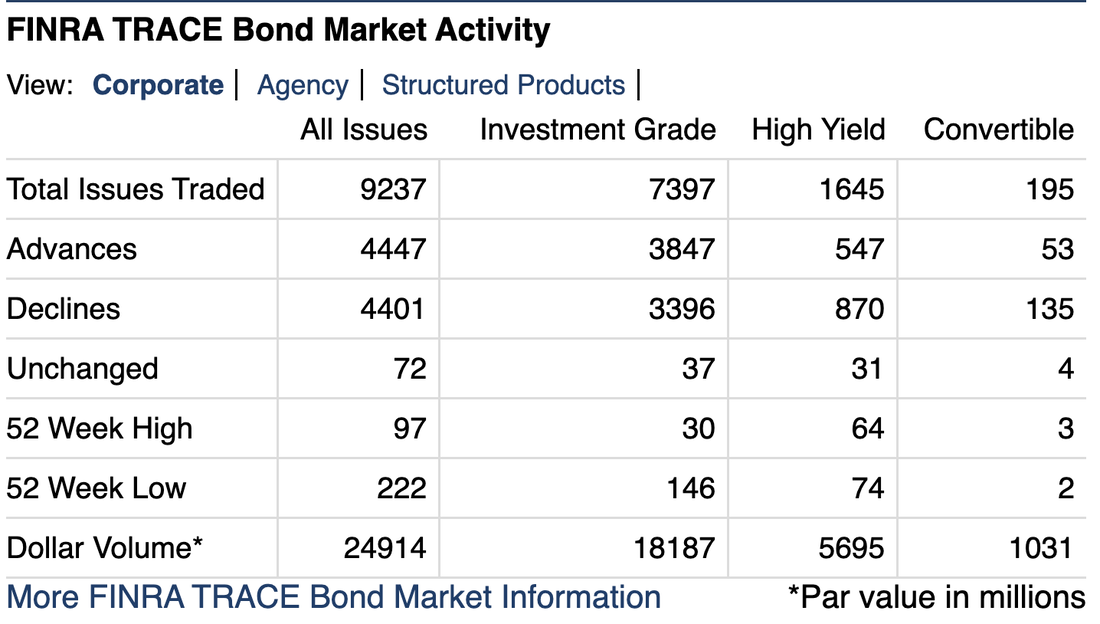 And now, check out our latest video where we explain how the market has turned RISK-OFF.
0 Comments
RISK OFF with risk-free rate at 4.625% and expected return to US stock 'risk' assets at 8.57%2/12/2023 We ran our analysis last night (Saturday night) with all corrections, adjustments and permutations made to our input parameters. We continue to learn more and evolve our understanding of stocks, ETFs, and the behavior of stocks. For example, we knew foreign companies trade differently, but now we see another way it happens, and how to account for it. We account for it without removing the foreign stocks anymore from our analysis.
With 3,076 stock passing our data validation last night (higher than it has been in a long time), and an expected return of all of those stocks, held evenly, of 9.12% and a variance of 3.434 x 10⁻⁴, we ran our models deeply. In fact, we have been running a few solvers all day today (still running), just to see where we end up. Not sure anything will change, but this way we feel more confident in our solutions. In conclusion: 1. The best individual assets are the ETFs that hold multiple stocks or bonds. That would make sense as ETFs with more than one asset should have lower risk than individual stocks without diversification. 2. The best CQNS Long stock portfolio (all common stocks or ETFs held evenly) hold 49 equities. The edge is tiny, 6.4 x 10⁻⁵, which is at least 1/5 the normal edge or alpha from the model. This is a very small edge, and may not be worth the transaction cost of managing 49 assets every day. So, we are risk-off in our stock picking. What would have to change to bring us to risk-on? 1. Risk free assets yield less. Today's yield of 4.625% seems low by historical standards, but is exceptionally high compared to zero. We could go back down again to ZIRP, or the zero interest rate program by the US Federal Reserve Bank, but likely not for a while. 2. US Equities become worth less when compared to intrinsic or fundamental value, and they are expected to rise. This could be due to a short-term liquidity driven event. It could also be a drop based on large-scale trades and positions by hedge funds, investment managers, and insurance companies. They do rotate positions. So, what is an individual investor to do? Stay conservative this coming week. Buy risk-free assets yielding 4.625% or more, and invest in passive equity index funds or ETFs. Avoid speculative bets on individual stocks for the short term. Thank you, Jeffrey Cohen, President US Advanced Computing Infrastructure, Inc. +1.312.515.7333 PS: If you still want us to deploy your assets based on the Chicago Quantum Net Score model, please contact us. We would be glad to work with you and our custodial agent, The Charles Schwab, to make this work. We can also work with your existing broker or investment manager. Hello faithful readers. We made a few adjustments to the model today (added back in the foreign stocks and added 1.0% to the expected return to stocks in capital appreciation.
What we expected to happen: The change in expected returns takes the return to risk to 4% from 3%, and maybe this would take our optimized long portfolio from 34 stocks to 24. This should not have been a big deal. The addition back of foreign stocks should have been material, but mostly on the 'not attractive' stocks as these would likely be higher risk. We did not consider that many foreign companies listed on US stock exchanges have closing prices that are 'painted' and controlled to make them look good. We saw this in the past with AeroCentury (ACY) and expect this still continues. What happened: The best portfolio has only two stocks. One is an ETF that is a 3x long / bull fund. That is expected as this particular fund is loved for its adjusted risk returns. The other stock is one that paid an enormous dividend due to COVID supply chain shocks. That makes the stock very attractive, but only if the dividend continues. What comes next: We cannot invest in an index and a stock that we know was picked because of last year's dividend in an industry that has seen 50% to 80% loss in pricing power, US congressional action to reduce their prices, and a weakening economy. We believe this is an issue with how dividends are treated in our model. They are given 100% credit for BETA impacts. Dividend paying stocks are promoted by our math, and the higher the dividend, the higher the promotion, on a linear basis. So, it is with a heavy heart that we need to finish our analysis, then run the whole thing again after dialing back the dividend support parameter. Better this than recommending a stock based on faulty logic. Disaster averted. Cya on Monday. Jeffrey Cohen President, US Advanced Computing Infrastructure, Inc. +1.312.515.7333 In this post we give the logic to include the logic to include US-listed, foreign companies in our stock portfolio optimization.
About a year ago we decided to reduce the number of stocks from our CQNS LONG analysis. This has a few benefits: 1. The analysis runs faster with fewer stocks 2. We could apply heuristics and lessons learned to improve (or not worsen) results 3. It tells a good story to clients and potential investors that we found anomalies to avoid, and 4. Foreign stocks appear to move more aggressively based on ad-hoc analysis. However, now we are not sure. Our model seems to ignore small caps and anomalous stocks in the best optimized portfolios without us having to remove them. It works as expected. On the downside of removing foreign stocks: 1. We lose visibility on these stocks and their anomalous behavior (we could all short them) 2. There might be an occasional anomaly that helps clients and investors 3. This is a false view of the overall markets, and 4. The heuristics of the market change, and our model will not catch the latest effects. So, starting Monday February 13 2023, we will add back the foreign stocks into our model and let them run. This will add a few hundred stocks back, and we would expect more odd and anomalous stocks to be in our secondary findings. Here is the list of foreign located / HQ stocks that are listed in US stock exchagnes: foreign_tickers = ['ERO','STN','LEV','PSFE','BNS','TD','CM','CNI','UBS','BEP','FERG','BIPC','STLA','BEPC','CAAP', 'NOMD','PAX','GLOB','OR','AMBP','WFG','CYD','VINP','ZIM','EURN','BAP','ABST','BTG','CGAU','PAAS', 'SAND','LSPD','MMX','IFS','SVM','XP','AFYA','ARCE','CCJ','EQX','RNW','BLDP','LAC','ACB','OGI', 'LGO','ADCT','NGMS','LICY','EXK','ARBE','CZOO','ORLA','DNN','GB','VSTA','GP','BWMX','ARVL','SATL', 'GRAB','NEWP','EQOS','ARQQ','HUT','QIPT','RY','BMO','TRI','CHKP','FNV','TIXT','TFII','DOOO','INMD', 'RDWR','CLS','CAMT','SA','AGI','AGRO','RADA','AG','TRMD','PAGS','CLBT','FSM','CO','TRQ','STNE', 'HTOO','HUDI','BAM','AY','DB','CPG','ATC','BUR','WPM','SII','AER','BPOP','CGEN','GLOB','GPL', 'PFLT','PLG','TURN','GFLU','GFL','VET','VECT','ABCL','ACGL','ACN','ADNT','AGYS','ALLE','AMCR', 'AON','APTV','AQN','ARGO','ATCO','ATY','AUDC','AUY','AXS','BBU','BCE','BIP','CB','CIO','CLB', 'CMBM','CMCL','CMRE','CNQ','CP','CRSP','CTRM','CVE','CWCO','CWK','DAC','BLX','DHT','DLNG', 'DOGZ','DOX','DSGX','EGLX','EGO','ENB','ESGR','ESLT','ESNT','ETN','EVTC','FBP','FLEX','FLNG', 'FN','FSV','FTS','G','GASS','GIL','GLOP','GOLD','GOOS','GRMN','GROY','GSL','GTE','HELE','HLF', 'HMLP','HOLI','HZNP','ICL','ICLR','IGT','IMO','ITRN','JCI','JHG','KEN','KGC','KMDA','KLIC','KNDI', 'KOS','LAZ','LIN','LMDX','LULU','LXFR','MAPS','MERC','MFC','MGA','MGIC','MTA','MTMT','MX','NAT', 'NGD','NOA','NTB','NTR','NVGS','NVT','OTEX','PERI','PNR','PRTA','QGEN','QSR','RBA','RE','RFP', 'ROIV','SBLK','SEDG','SJR','SPNS','SPNT','ST','STX','SU','TEL','TGA','TGLS','TK','TRP','TRTN', 'TSEM','TT','WCN','WTW','APT','CAAS','CNTG','CREG','DPRO','FLGC','FRO','FSI','FTFT','GSMG','IFRX', 'IMCC','IMTE','JWEL','KNOP','LBTYA','LBTYK','MDT','MNDO','NMG','OCG','OFG','QLI','RACE','SIG', 'SILC','SNT','TNK','VLNS','KARO','MYFW','GIB','SDH','SHOP','SSRM','STE','APM','ALYA','BCTX', 'CIXX','CPRI','CSIQ','DLO','HITI','IHS','ITRG','MEOH','SLHG','VMAR','UROY','TIGO','TECK','BITF', 'CPOP','IS','SLI','APWC','BHAT','BNSO','BOSC','EDTK','EXN','GAME','AEM','AGO','ASM','ASPS','BB', 'CBAT','CYTO','GTEC','HIVE','IFBD','JZXN','MHLD','NXE','PRQR','SLF','SOLO','APTO','GTX','ITP', 'FAMI','METX','EJH','GAMB','GMVD','IINN','PBTS','STVN','VTEX','ZENV','DOLE','OSW','AEHL','BAOS', 'CLPS','CYBN','IPA','KIQ','OXBR','SNTG','SYTA','THTX','UTME','YGMZ','CNHI','ARCO','BGI','CPA', 'GLBS','GOGL','GPRK','KRNT','NETI','NM','NMM','SHIP','TARO','DSX','DESP','FTCH','GRIN','SRAD', 'ONON','PLYA','CSTM','PBA','TU','NVEI','TCN','ASTL','KNSA','GOOGL','PRM','TBPH','FG','BN', 'ABUS','ACIU','AFMD','ALKS','ALLT','ASC','AUPH','AZRE','BHC','BLU','BORR','CGC','CGNT','CIGI', 'CMPR','CPNG','CRDO','CRNT','CRON','CVAC','DCFC','DRIO','EMX','EPIX','ESTA','EVTL','FREY','FSTX', 'FTI','FVRR','GENI','GLBE','GMDA','HBM','IMAX','IMTXS','INDO','IREN','JAZZ','JRVR','LIVN','MANU','FAXN', 'MMYT','MNDY','MNMD','MRUS','MYOV','NBR','NEXA','NFGC','NG','NNOX','NU','NVTS','OBE','OFIX','ORMP', 'PDS','PLTK','PRMW','PXS','RCI','RIG','RNR','RPTX','RSKD','SGHC','SILV','SMWB','SPOT','STKL','TAC', 'TCX','TSAT','URGN','VAL','VRCA','WBX','WFRD','WIX','WKME','WRN','WVE','XENE','ZGN'] Here are the 10 stocks with largest volume vs. last year's average volume. They all traded 7.5 to 37.4 times more shares yesterday than normally traded in a day.
Are these stocks in play? High volume could also mean changes in positions of institutional and high net work individuals. 1 CSII Cardiovascular Systems Inc. 3739.9% 2 GMED Globus Medical Inc 2144.5% 3 LIFE Atyr Pharma Inc 1524.8% 4 NUVA Nuvasive Inc 1376.1% 5 EIGR Eiger BioPharmaceuticals Inc 1289.7% 6 SUMO Sumo Logic Inc 1113.7% 7 BLBD Blue Bird Corp 1100.0% 8 AI C3.ai Inc 849.4% 9 IFF International Flavors & Fragrances Inc. 784.9% 10 AZTA Azenta Inc 783.4% Here are the 10 stocks with smallest volume vs. last year's average volume. They did not trade very much yesterday, under 10% of last year's average daily volume.
0 HUSA Houston American Energy Corp 2.5% 1 TRHC Tabula Rasa HealthCare Inc 3.0% 2 LGVN Longeveron Inc 3.4% 3 SST System1 Inc 5.2% 4 TXMD TherapeuticsMD Inc 5.7% 5 IVVD Invivyd Inc 6.2% 6 CVM Cel-Sci Corp. 7.6% 7 CASA Casa Systems Inc 7.9% 8 USEG U.S. Energy Corp. 8.8% 9 ADN Advent Technologies Holdings Inc 9.6% Good morning. Our model is up to 34 stocks held evenly in the optimized CQNS Long portfolio. This portfolio would be hedged by shorting the $SPY by a BETA-weighted amount.
The benefits of stock picking declines when short-term interest rates approach the expected return of stocks. We only see four stocks with a better risk-adjusted return than the indices: 2 PNM PNM Resources In -0.000044 5.23% 0.60 1.06 0.00113 1.04 0.20 4 IEP Icahn Enterprises L P -0.000020 5.66% 0.79 1.10 0.00243 1.16 0.30 5 BRK.B Berkshire Hathaway Inc. -0.000019 6.89% 0.77 1.01 0.00560 1.00 0.77 6 AME Ametek Inc -0.000007 7.17% 0.69 1.13 0.00684 1.01 0.86 All of these stocks pay a dividend. That helps in a risk-off market. Good luck in the markets today. Stay safe. We realize that factors that describe stocks, like BETA values, and kurtosis which are calculated over the past year are changing quite a bit between January 12, 2023 and February 6, 2023.
We maintain US listed stock portfolios of these types of factors. More than half the stocks in each list are different over the past month. This means that edges provided by mathematical anomalies from normal distributions may not last more than a month, on average. Today's 31 stocks are quite different than the stocks selected yesterday. One notable difference is that Google is out and Facebook (or META) is in.
The reason that the market is risk-off is that the expected return is not that much larger (~3x) than the cost of the risk of portfolio variance. So, don't go 'all in' on a few stocks and hold a diversified portfolio. Our 31 stock portfolio contains gold $AAAU and US Treasury Bond ETFs $SHY and $TLT. Good luck in the markets today. Here are our picks for a long portfolio, starting at market open today. ['AAAU', 'ACI', 'ATVI', 'CFFN', 'CME', 'ELME', 'EWCZ', 'FROG', 'GEN', 'IEP', 'INST', 'JNJ', 'K', 'LHCG', 'LMT', 'LOCO', 'MCD', 'META', 'MGI', 'PCAR', 'PEBO', 'PFSW', 'PNM', 'QCOM', 'SHY', 'SPH', 'SPOK', 'TGNA', 'TLT', 'TXN', 'ZGN'] 31 We will track these starting today for 20 trading days. We explain in detail what that means and why we believe that US Equities are heading for a period of time when investors should increase their diversification and reduce their most risky positions. We completed our corporate taxes last night and submitted them.
A few thoughts: Our IT and market data costs have grown, and continue to be significant. The process of being licensed by FINRA and being a member of QED-C is also a relevant cost to our business. Finally, we are operating with very limited labor costs. As we grow, this will become our dominant cost category. Overall, we have mostly fixed costs in our business. Therefore, growth in client orders generates positive net income and operating leverage. |
Stock Market BLOGJeffrey CohenPresident and Investment Advisor Representative Archives
July 2024
|
 RSS Feed