|
By Jeffrey Cohen: Investment Advisor & President, US Advanced Computing Infrastructure, Inc.
$LWLG Lightwave Logic Our short position (CQNS DOWN #1 pick) continues to rise. This is the most inefficient stock among the negative net income crowd. In fact, after a little DD, it has no revenue and likely will dilute their equity further to fund 2023 operations. This stock has expensive PUT premiums that are not moving very much vs. the change in stock price. We will either short the common stock (if shares are available), or buy puts if the premiums fall. Our long position has been singing Nickelback's Rockstar. We identified a three-stock portfolio for a client over the weekend (significantly more efficient than the SPY, which came in at #190). This group of stock has shot higher right out of the gate. From Monday morning, these three stocks rose with the market. LWLG: Open 9.27, now 10.71 $SI (Silvergate Capital), $SITM (SiTime), and $UPST (Upstart Holdings, Inc.). (This week's CQNS Long portfolio is oddly diversified in high-tech and innovative companies. One makes semiconductor timing systems (clocks on a chip), one funds bitcoin investments, and one is an AI-based lending platform. SI: Open $150.00, now $160.52 SITM Open $253.97, now $266.00 UPST: Open $104.30, now $120.17 Benchmark $SPY SPY: Open 452.06, now 461.55 Good luck to all. Summary: The CQNS UP model has been an exceptional performer while this market has been rising. It is picking stock portfolios that are efficient, and have risen far in excess of the S&P 500. Two weeks ago we picked a portfolio of winners (for the first 2 weeks of trading), and this week looks no different.
0 Comments
We maintained our over-performance vs. long the $SPY, or S&P 500 ETF over 10 trading days. Our 5-stock CQNS UP portfolio rose 19.86%, or 12.31% greater than the $SPY (excluding dividends). Our 12-stocks CQNS UP portfolio rose 19.50%, or 11.94% greater than $SPY (excluding dividends). In an upward moving US equities market, our 'short' or down portfolio rose slightly more slowly than the $SPY. Our two 'DOWN" stocks rose a combined 6.51% over the period, which is 1.04% more slowly than the $SPY. In summary, in a rising market our CQNS "UP" portfolio is significantly out-performing the $SPY while our CQNS "DOWN" portfolio (limited to two stocks) is slightly out-performing a short $SPY portfolio. 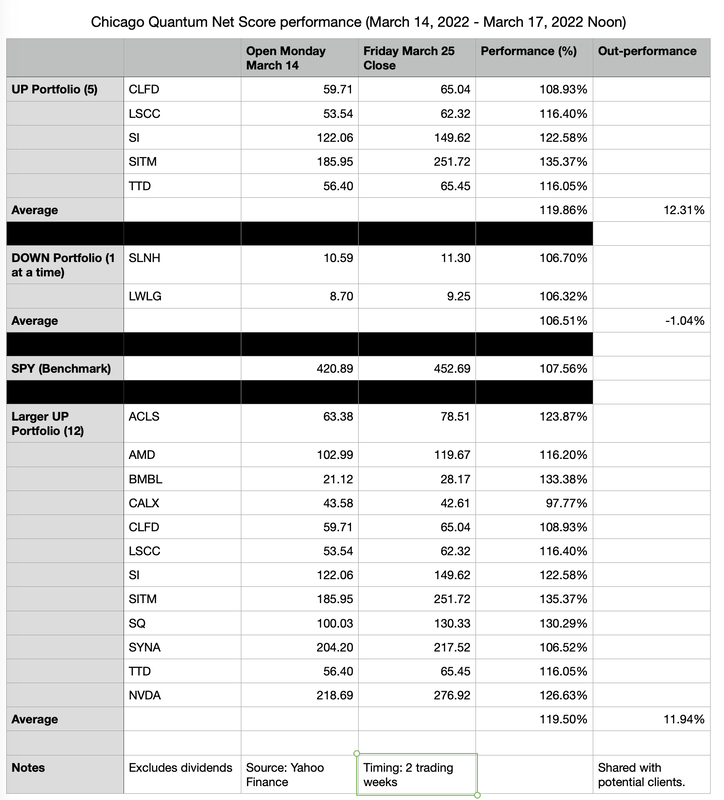 We will be running our CQNS "UP" and "DOWN" portfolios this weekend to select a new set of portfolios. Notes: We mailed letters (US mail) to potential clients sharing our portfolio picks which should have been delivered about a week ago, which may have impacted performance.
We do not have a position, nor have we traded any of the stocks listed above. We are considering whether to create separately managed account(s) which may contain then current best "UP" and "DOWN" portfolios in a mix of long and short positions to capture the over-performance of the model while hedging away overall market risk. 1. Long portfolio without 'short' hedging market results 2. Long portfolio with 'short' hedging market performance 3. Long and short to capture both "UP" and "DOWN" over-performance vs. $SPY (hedged) 4. Long and short to capture nominal performance of both UP and DOWN portfolios. 5. Purely short "DOWN" portfolio. Your comments and participation are welcome. Please review our brochure available on our homepage at https://www.chicagoquantum.com for more information on our fees and services. Chicago Quantum Net Score Results
Monday, March 14, 2022 (market open) - Thursday, March 17, 2022 (~Noon ET) By: Jeffrey Cohen, President and Investment Advisor Representative On March 13, we published a BLOG post that gave the ‘best’ or most efficient portfolio we had found using data from March 11, 2022 market close. That is an UP or long portfolios. We also identified a 12 stock UP portfolio which we did not publish, that had a similar (but very slightly less efficient) score. We also published two stocks which individually are the least efficient stocks, which would be DOWN or short portfolio.
Results: SPY: +3.71% UP (5 stocks): +13.57% UP (12 stocks): +13.95% Down (2 stocks): +0.93% Net-net:
This is significant performance of our model during an active, FOMC week. For more information, visit our website at https://www.chicagoquantum.com. US Advanced Computing Infrastructure, Inc. You can find the BLOG post by visiting our website, ‘Research’ tab, first menu ‘Today’s Insights from CQNS.’ Our brochure is available from our homepage. Jeffrey Cohen, President and Investment Advisor Representative
March 13, 2022 22:05:00 CT On Friday night we ran our CQNS UP and DOWN runs for our house account. 11,064 US listed tickers traded on Friday, and a total of 1,111 DOWN and 2,401 UP US common stock tickers passed data validation. UP and DOWN are analyzed and run separately. If you hold all DOWN stocks evenly, the expected return is 7.51%, for a variance cost of 0.00033. If you hold all UP stocks evenly, the expected return is 6.07%, for a variance cost of 0.00012. investing Key takeaways (KTAs): 1. Equity market expected return for the next year is 5%. This is below current inflation. 2. Three (UP) and four (DOWN) stocks have significantly better scores than holding all UP or DOWN stocks evenly. They are UP: $LSCC $NVDA $ACLS and DOWN: $MARA $MXL $PI and $FTCH. There are fewer 'all-stars' than normal. 3. You should expect a 24% larger return and 175% larger price volatility when investing in companies with negative vs. positive net income in the latest quarter reported. 4. Diversification hurts DOWN short bets. You would expect to do best by shorting one of two stocks $SLNH and $LWLG. If you short them together, equally (say $10k apiece), your expected result declines by about half. This is the ultimate dog-star hypothesis coming true. The worst individual stocks are the worst portfolios. 5. Diversification helps UP long bets. The best one stock has a 50% lower expected result than eight portfolios varying from 4 to 9 stocks held evenly. These 'best' portfolios found have 9x the expected performance than holding all UP stocks evenly (full diversification). 6. The best, or most efficient portfolio found, has 5 stocks held evenly: $CLFD $LSCC $SI $SITM $TTD. This is an academically and mathematically interesting result. These stocks have individual CQNS UP rankings of 0 (best), 431, 1,357, 175 & 1,460. This breaks the 'all-stars' hypothesis that says that the best portfolio is made up of the best individual stocks. This may only be true when expected returns are higher than they are today. - When expected returns are lower, it is more valuable to find ways to reduce price volatility beyond simple heuristics. Variance costs outweigh expected returns. - When expected returns are higher, buy higher BETA stocks and hang on for the ride. Returns will outweigh variance costs. We now discount the price of our full market CQNS runs to $500 apiece until further notice. Last year they sold for $750, but we understand this is a declining market. Finally, we have some ideas to test next week. We are going to inject a few relevant tickers into our run to see if they materially change the 'best portfolios found.' You can probably guess what they are (indices? commodities? crypto?). Let us know if you want to collaborate, or have us test your hypothesis. |
Stock Market BLOGJeffrey CohenPresident and Investment Advisor Representative Archives
July 2024
|
 RSS Feed