|
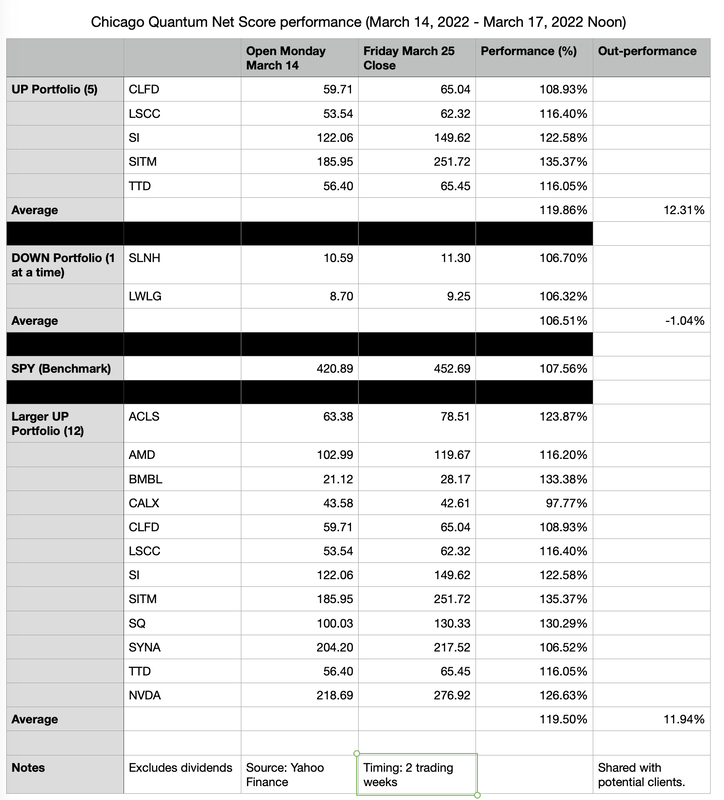
We maintained our over-performance vs. long the $SPY, or S&P 500 ETF over 10 trading days. Our 5-stock CQNS UP portfolio rose 19.86%, or 12.31% greater than the $SPY (excluding dividends). Our 12-stocks CQNS UP portfolio rose 19.50%, or 11.94% greater than $SPY (excluding dividends). In an upward moving US equities market, our 'short' or down portfolio rose slightly more slowly than the $SPY. Our two 'DOWN" stocks rose a combined 6.51% over the period, which is 1.04% more slowly than the $SPY. In summary, in a rising market our CQNS "UP" portfolio is significantly out-performing the $SPY while our CQNS "DOWN" portfolio (limited to two stocks) is slightly out-performing a short $SPY portfolio. We will be running our CQNS "UP" and "DOWN" portfolios this weekend to select a new set of portfolios. Notes: We mailed letters (US mail) to potential clients sharing our portfolio picks which should have been delivered about a week ago, which may have impacted performance.
We do not have a position, nor have we traded any of the stocks listed above. We are considering whether to create separately managed account(s) which may contain then current best "UP" and "DOWN" portfolios in a mix of long and short positions to capture the over-performance of the model while hedging away overall market risk. 1. Long portfolio without 'short' hedging market results 2. Long portfolio with 'short' hedging market performance 3. Long and short to capture both "UP" and "DOWN" over-performance vs. $SPY (hedged) 4. Long and short to capture nominal performance of both UP and DOWN portfolios. 5. Purely short "DOWN" portfolio. Your comments and participation are welcome. Please review our brochure available on our homepage at https://www.chicagoquantum.com for more information on our fees and services.
0 Comments
Leave a Reply. |
Stock Market BLOGJeffrey CohenPresident and Investment Advisor Representative Archives
July 2024
|

 RSS Feed
