|
Good morning readers. This blogpost was written by Jeffrey Cohen, President and Founder of US Advanced Computing Infrastructure, Inc. d.b.a. Chicago Quantum. We document the change in relative spend by major category from 2016 to 2023 and draw conclusions on the elasticity of demand and where our best guess takes us for spend in 2024. In 2024, would expect weakness in retail, food & beverage, and services. Services will be weak because of entrenched inflation in that sector (~6% for 2 years). We expect flat demand in commodity goods, supported by near-zero inflation. Energy spend will rise in 2024 as prices are currently rising and demand is inelastic (hard to change demand in a short period of time). The August 2023 headline inflation reading of 3.7%, and the core CPI reading of 4.3%, indicate that inflation is not defeated, but is stabilizing at around 4% after dropping to the low 3s. What happened is that two widely consumed items are significantly more expensive, shelter and all energy (especially gasoline). For those who own cars, auto insurance is also significantly more expensive. September will likely be more of the same as the price of oil globally continues to rise, U.S. foreign trade in goods slows down, the world deals with natural disasters, interest rates rise (making capital more expensive), and both China and Japan continue to stimulate their economies with easy money. However, the biggest driver in the US in September will likely again be shelter and energy prices. Different regions of the country are facing different levels of inflation. Chicagoland (2.3%) has very low inflation, while the Miami metropolitan region (7.8%) grows significantly more expensive. Annual inflation is lowest in the Northeast (2.8%), then Midwest (3.4%), then West (3.9%), and highest in the South (4.1%). Our focus for this article is about what Americans are spending their money on. A focus on the weighting of the inflation data to reflect the importance of those categories. In short, the US Bureau of Labor Statistics' best guess on where every $1.00 is spent, excluding farmers, military personnel and those in institutions. In 2023, the American consumer spent less on energy and allocated that spend to services. Services are made up of Shelter, Medical Care and Transportation. Here is a snapshot for the past two years, with changes from the prior year.
We see different patterns each year of primary spending changes: 2023: Services + 1.9%; Energy -1.8% 2022: Energy +1.5% and Commodity +0.5%; Food -0.4% and Services -1.7% 2021: Energy +1.1% and Commodity +0.6%; Food -0.3% and Services -1.4% 2020: Food +0.9% and Commodity +0.8%; Energy fell 1.6% 2019: Services +0.6%; Energy -0.3% and Commodity -0.3% 2018: Energy +0.8% and Commodity +0.7%; ; Food +0.4% and Services -1.1% 2017: Services +0.4%; Commodity +0.5% Spending percentages for the US consumer is by definition a zero-sum game. However, as inflation changes became larger, the shifts in spending between categories has grown. We are seeing more significant shifts in where money is being spent. We have this table created starting in 2016. Source: US Bureau of Labor Statistics, Consumer Price Index current release and archive for August of each year. Found here. 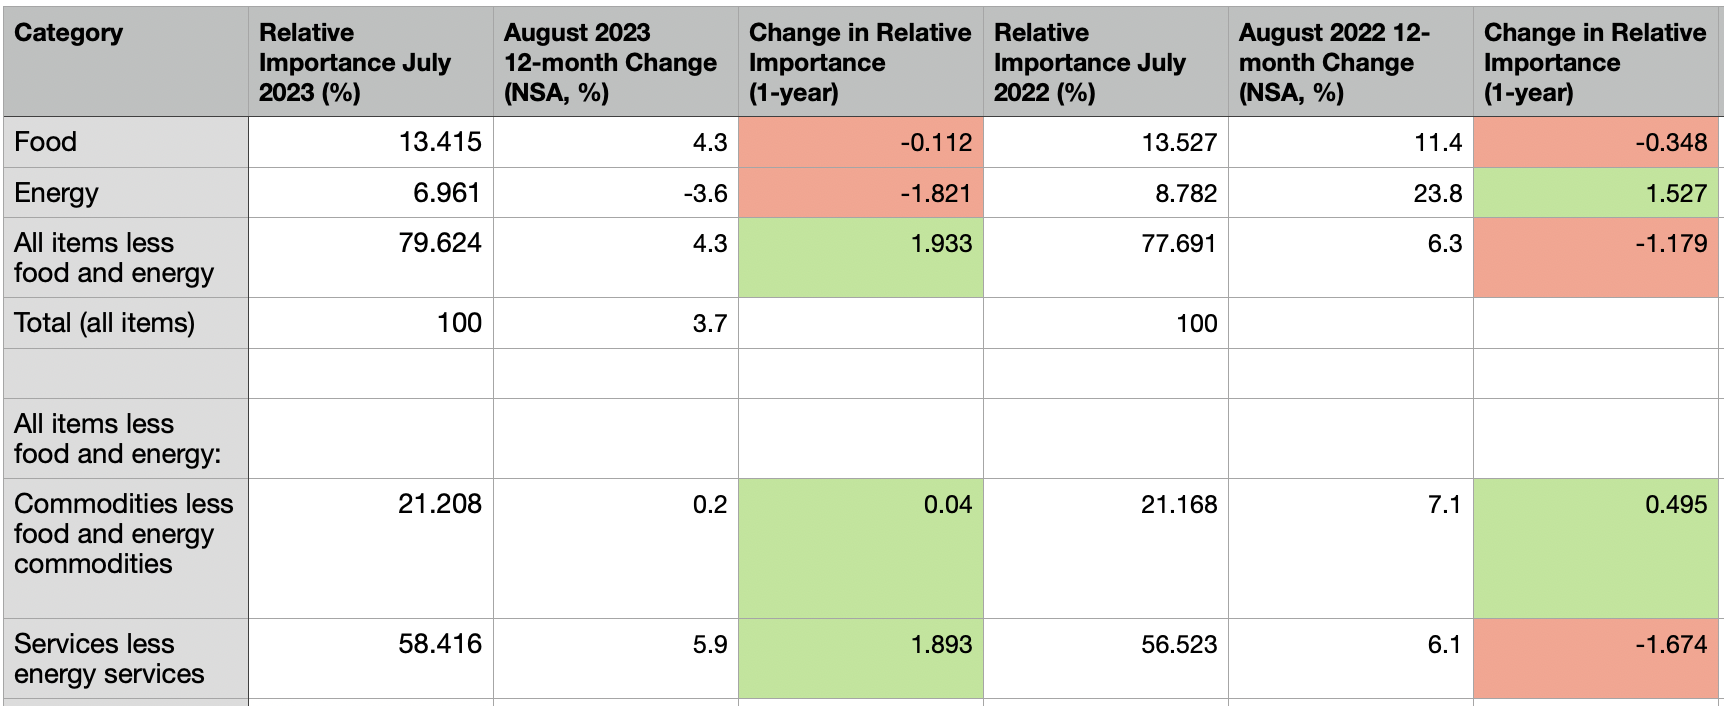 Where does 2024 lead? That is the stock picker's key question.
Food spend seems elastic and maintains a fairly flat percentage of spend, which implies that consumers either eat less, or make lower-cost choices for their 2,000 calories per day. Energy spend appears inelastic over the period, so if energy prices rise, so does relative spend. Spend on commodities, things like apparel and vehicles, has been rising consistently, last falling by 0.3% in 2019. This looks like a systematic shift to spending on goods. Services spend have the largest annual fluctuations, and don't seem to be impacted by services inflation. It could be as simple as people pay for energy and commodities first, then food, then spend the rest on services (and of course savings). Relative consumption changes for 2024 (Our best guess): - Energy prices are currently rising, and this will draw spend from other categories. - Food prices are rising, but consumption will continue to fall to keep this relatively flat. - Services inflation continues to rise with wages, but consumption will fall, maybe lowering the relative spend on this category. - Commodities inflation is near-zero, which may support flat consumption. Impacts on industries (our best guess): Retail (general, grocery and high-end) will see flat demand. Food establishments will see declining demand and margins. Services businesses will see higher wage costs and lower demand. Only the strong will survive. Energy prices rising (oil, gasoline, electricity and maybe not natural gas) takes first priority on spend.
0 Comments
Leave a Reply. |
Stock Market BLOGJeffrey CohenPresident and Investment Advisor Representative Archives
July 2024
|
 RSS Feed