|
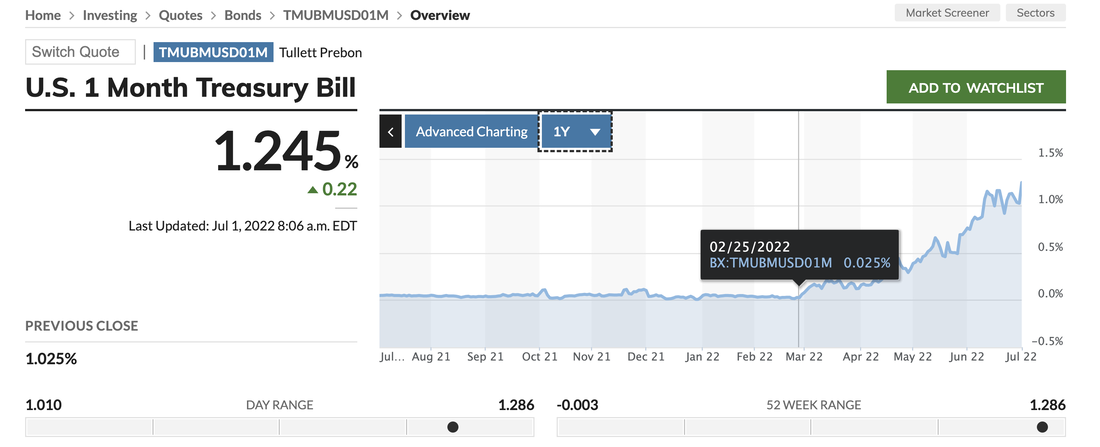
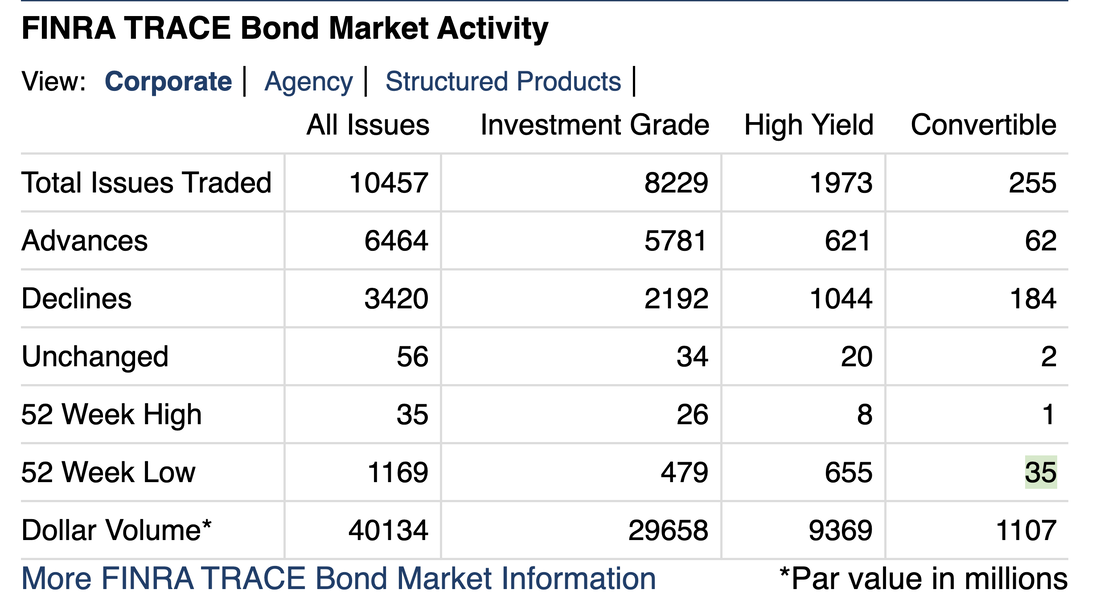
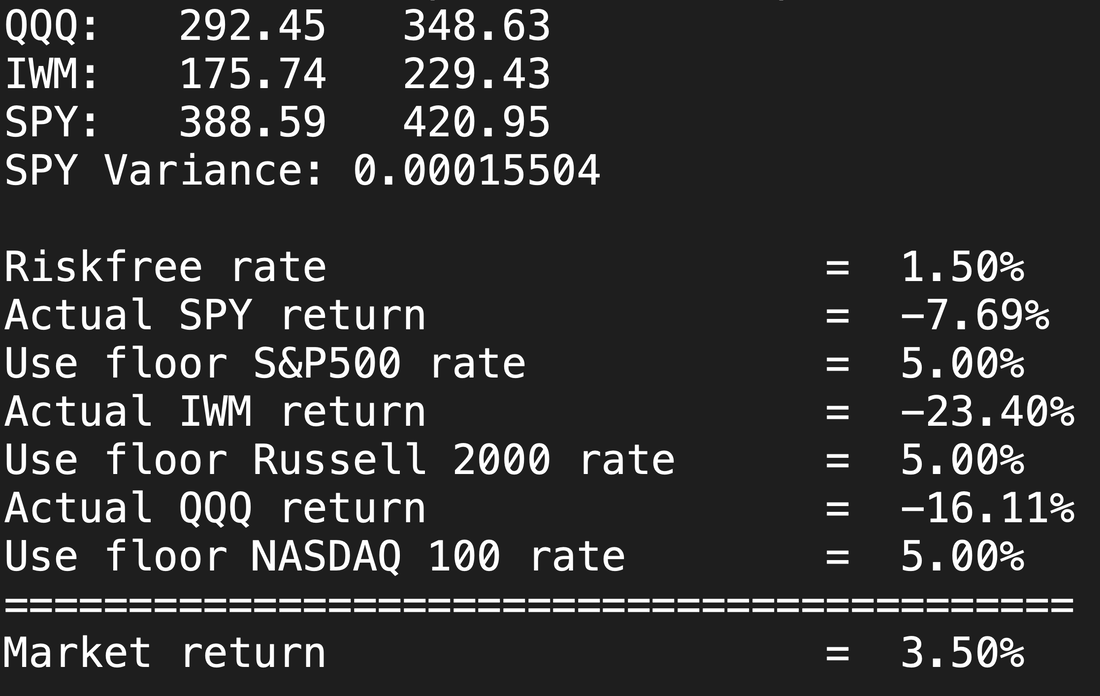
Good morning. Money now is worth more than money later. What do we mean? The interest you can get from the US Treasury on 3-month T-Bills is 1.27%, but you get less than 3% if you lend the US Treasury money for 10 years. The 3-month yields are skyrocketing this morning. Cash is King today. The other thing we noticed was New Highs and New Lows are out of balance again. Fixed Income / Corporate 1:35 New Highs to New Lows US Equities: 1:36 New Highs to New Lows We also noticed the VIX is trading to suggest a 1 standard deviation move in the S&P 500 of 1.51%. That seems about the range we are getting used to. Bonds are rising quickly to their last support level, which could make this a resistance level, or something like that. What we really mean is that US Treasury Bonds and Notes are going up in price, pretty quickly, from where they were mid-June. This surprising, and suggests either recessionary fears in the market or the Federal Reserve Bank and regular banks doing some serious buying at month-end. This could be the 'rebalancing' that everyone was talking about. It happened quickly and powerfully in fixed income at the end of June. We will watch for that next quarter as well. Copper is falling, along with Silver and Gold. Copper hit $3.57 while we were watching, and we reflect that copper can easily trade in a $2.00 range when the economy is weak / recessionary. As a result, a major copper miner $FCX or Freeport McMoran is down fast and hard. It has more to fall if copper keeps falling. This is like the steel industry right now, those stocks are crashing too. The final thing we noticed is the strong US Dollar vs. the Euro. The EuroDollar is trading 1.0418. Whatever is happening in the US with rates and quantitative tightening is outpacing, even if slightly, what they are prepared to do in Europe to control inflation. Good luck in the markets today. Jeff BTW, in the video we share some 'inside baseball' in our model. For example, here is our pick for the day, CQNS UP Run, best risk-return portfolio. ['AMD', 'BX', 'COIN', 'DDS', 'EBIX', 'MELI', 'MXL', 'NVDA', 'SGRY', 'SI', 'SITM', 'TTD'] Chart of market returns (ex. dividends) over the past year for 3 major US Equity Indices. Our model return to risk assets (fully diversified) is 3.5% over the next year, including dividends.
0 Comments
Leave a Reply. |
Stock Market BLOGJeffrey CohenPresident and Investment Advisor Representative Archives
July 2024
|


 RSS Feed
