|
By Jeffrey P. Cohen, Investment Advisor Representative
US Advanced Computing Infrastructure, Inc.
Inflation numbers came in. Consumer prices accelerated higher in May 2022. Link here.
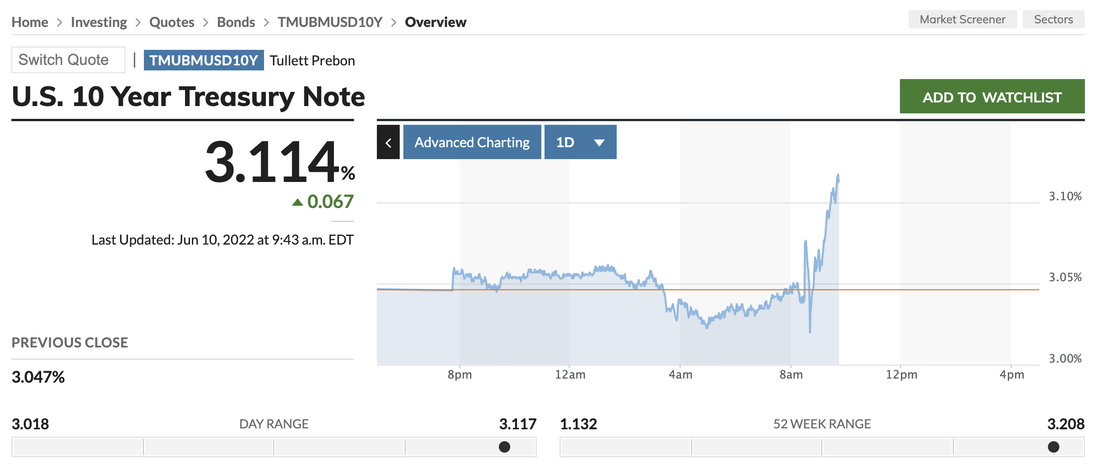
10-year US Treasury Note Yields are screaming higher this morning. Up to 3.114%
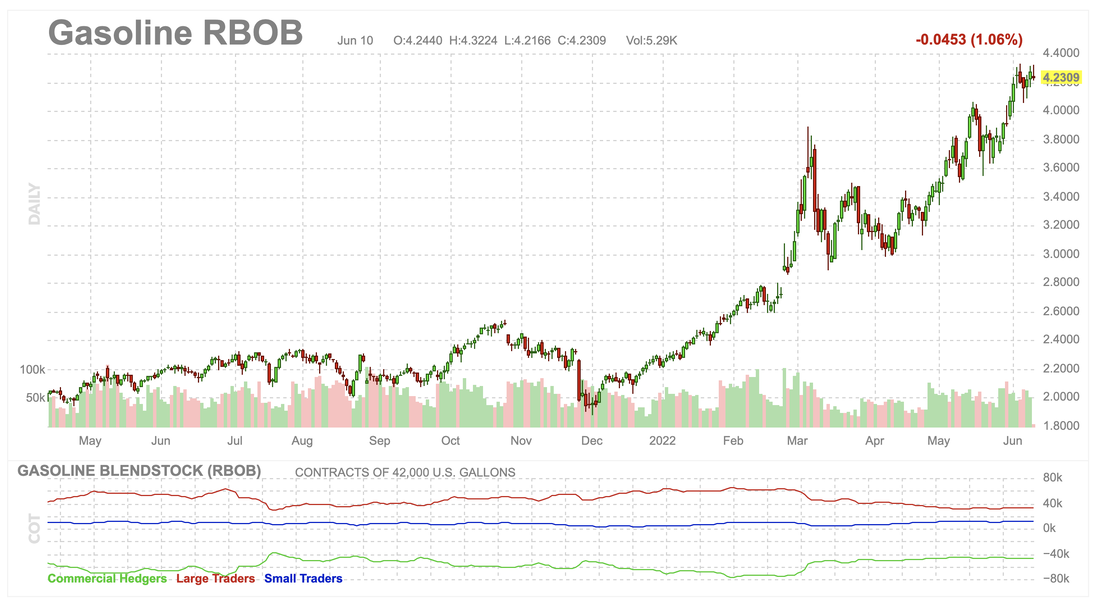
Gasoline prices are down ~1% today. They are seemingly immune to the market action and concern over their prices. Gasoline is still trading over $4.23 / gallon wholesale, untreated, awaiting transportation.
We finished running our models last night, as we now do every night.
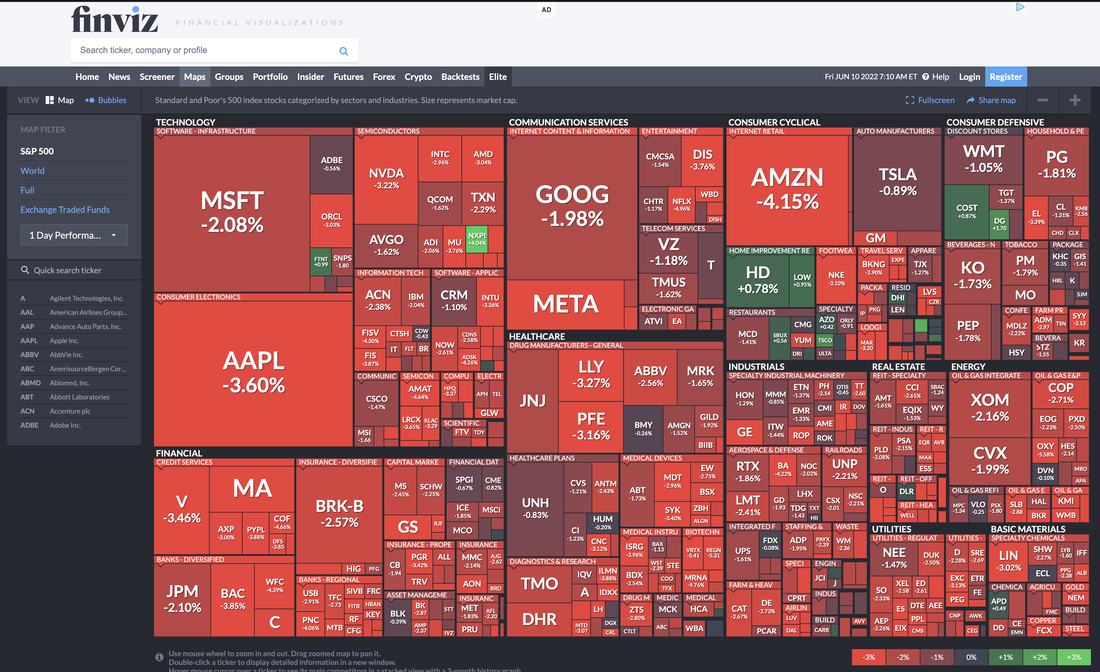
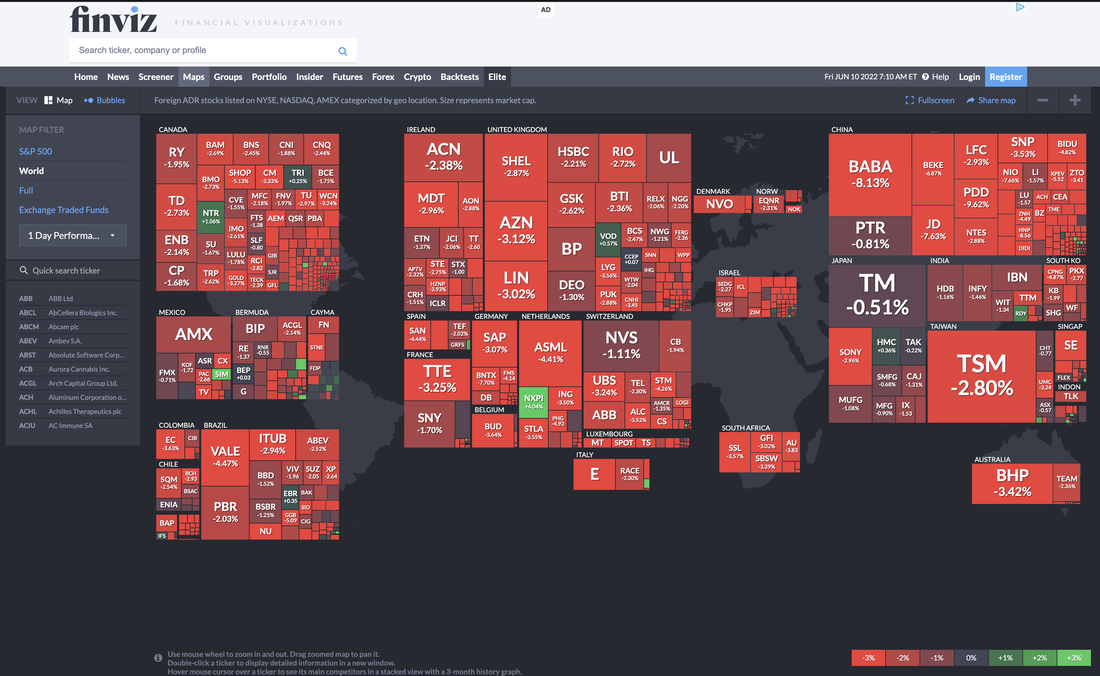
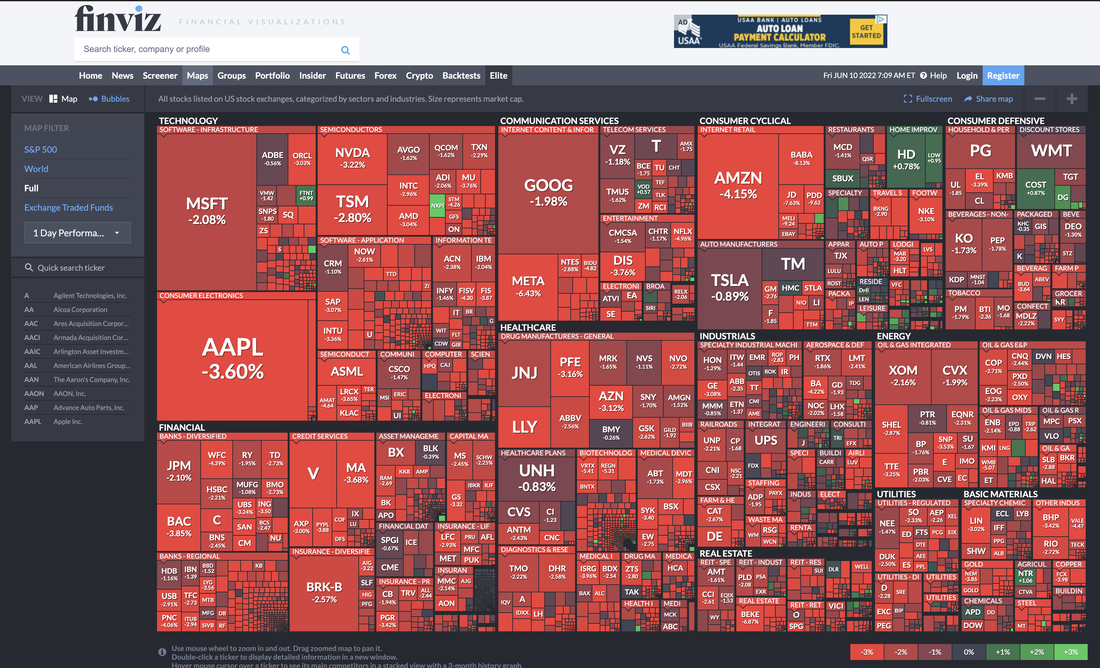
The CQNS Down runs are faster. We usually have these after a few hours. This is because if you are going to short a portfolio in a least risky way...it should be a smaller portfolio. Our models can focus on smaller solutions and this takes last time. Lately, the model has been identifying anomalous stocks in a tricky trading environment. We find stocks that are seeing significant price and volume movements, followed by calmness and generally, weakness. Yesterday we really wanted to short a small-cap stock that is dramatically over-valued. However, we ran into a pattern on two of these ($RGC and $VIEW) in that there was zero borrow. So, we could only watch. BTW, both continued their relentless climb higher into the stock 'stratosphere' and we will watch those for an eventual fall. Others like $INDO started their descent earlier this week and are down significantly. We personally have only so much capital to risk in this market (we are in a downtrend, and most of our capital is side-lined), so we are missing most of these. This is why we offer our services to clients, so others can take advantage of the literally 3,000 stocks we analyze and profit on the anomalous down-run picks. The market fell into the close. Why did the market fall yesterday? Yesterday, we saw a down market where the indices started out green, then moved to the RED by the end of the day. I read pundits that said it was because investors are worried about inflation. The problem is that we have had inflation for over a year now, and so it does not explain yesterday. The losses were wide-spread as you can see in the charts below. Funny thing is, we were trading one stock yesterday and did not really notice the market falling. I guess nobody knows why markets rise and fall except for the market makers (who see supply and demand) and the regulators (who have the data after the fact). If I had to make a guess, I would say more shares and equity index futures were sold than bought yesterday. This also could be a corporate fixed income driven drop as companies may not have the earnings and cash flow to meet their obligations. Inflation fears create recession fears, and reduce overall economic demand in the short-term. Rising interest rates, if they indeed rise as indicated, are also demand destruction devices. So, maybe the bet against stocks yesterday was due to recessionary fears driven by inflation and inflationary counter-measures. Images from Finviz www.finviz.com. Thank you. Data from our runs comes from Intrinio. Chicago Quantum is powered by Intrinio. www.intrinio.com
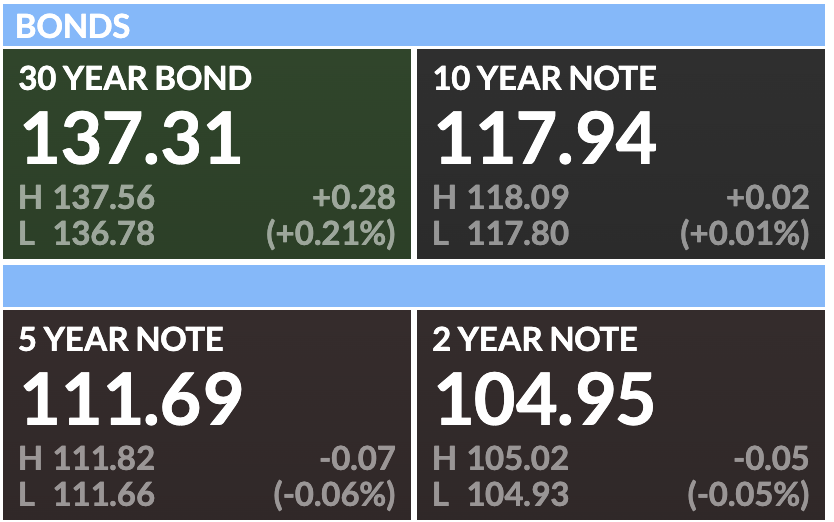
We also noticed a few other things in the market. US Treasury Bonds are holding on nicely, despite the upcoming rate hikes and quantitative tightening to start in June 2022. These are the same numbers we have been seeing all week, and indicate a stability for fixed income that we welcome.
30-year US Treasury Bonds yielding 3.148% 10-year US Treasury Notes yielding 3.039%
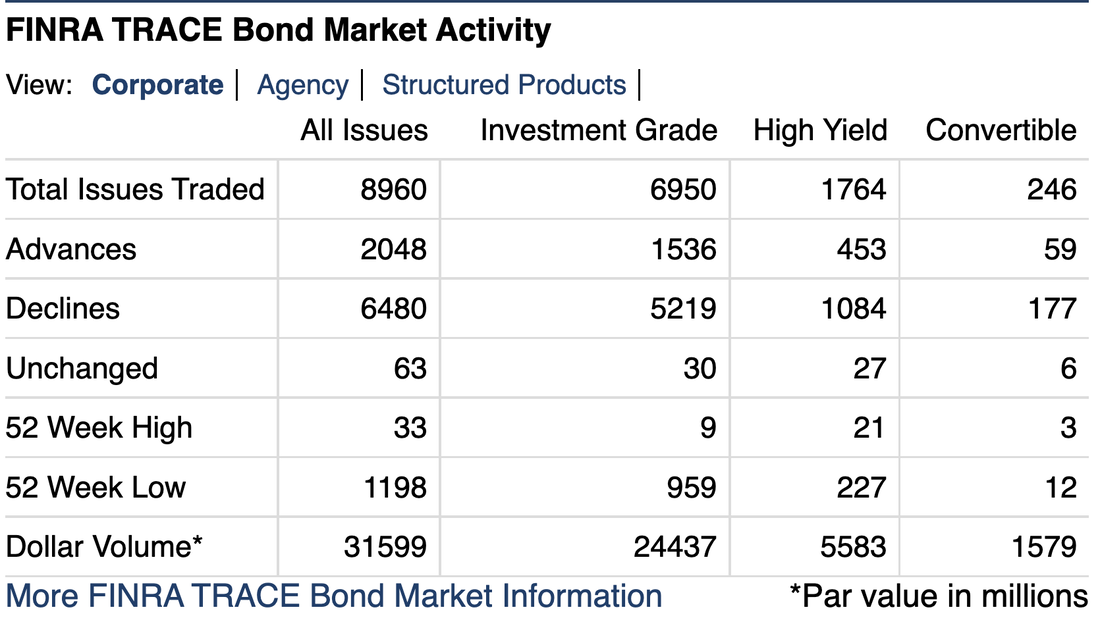
On the corporate fixed income side, things are not doing as well. Yesterday was a very weak day.
Decliners and new lows outpaced advancers and new highs, according to Finra & Morningstar. Look at the investment grade corporate bonds: 9 new highs vs. 959 new lows. These are stunning metrics.
So, where does that leave us in pre-market today?
The US equity futures are flat to down, about 2 hours before market open. Bitcoin is trading right at $30,000 (it is actually $30000.13). Take $0.10 off and you have a palindrome. Ok, that was just a moment in time, it is now $30,004.38. This is a support and resistance level for Bitcoin. Range-bound. Currencies are interesting this morning. They changed from last night. EuroDollar at 1.0573 means a stronger dollar DollarYen at 133.95 is about the same as we've seen it, and is a historically strong level for the USD. DollarYuan is 6.6958 which is a very strong USD, and support continued imports from China. DollarMXNPeso is 19.725 which is recently strengthening in USD, but down from last year when the Peso was much weaker (reached almost 22 Peso/Dollar). USD/CAD is 0.7836. This is largely range bound between $0.80 and $0.77. Both DollarYen and DollarYuan imply a 'free shipping' offer from our large, overseas trading partners.
We follow global, physical mining stocks and companies that produce steel in the United States. These stocks fell out of bed yesterday. The valuations are not at the lows we saw recently, but they are showing weakness. This is an economic bell-weather sub-sector.
However, trucking and transportation was mixed yesterday, and is set to open mixed today. There is some strength in trucking stocks. Other industry indices (proprietary) that we follow: Quantum Computing Companies: UP PCs and Chips: mixed Chips and Semiconductors: UP Cannabis and Tobacco: Mixed / UP Physical miners: down, Crypto industry: UP Retail / Specialty Retail: mixed, flat, no big moves PM Money Managers: mixed / DOWN High BETA stocks: mixed and our two long positions are flat: ($CRBP & $AMS)
The VIX, or the CBOE Volatility Index, is trading at 26.59. This is up versus the past few days, but is down from recent highs when it scored above 30.00. It is up this week, but as you can see in the weekly chart, it is not significantly elevated.
0 Comments
Leave a Reply. |
Stock Market BLOGJeffrey CohenPresident and Investment Advisor Representative Archives
July 2024
|


 RSS Feed
