It's 2pm ET: The Fed decided to not roll over $47.5B of securities it owns in June, July and August.
Then, in September, October and November, it will withdraw (or not roll over) $95B per month. It will continue to reduce the size of its assets until: "Over time, the Committee intends to maintain securities holdings in amounts needed to implement monetary policy efficiently and effectively in its ample reserves regime." Plans to reduce the size of the Federal Reserve's balance sheet It is raising interest rates now to about 1% (or slightly less), then will continue to raise them. We heard Chair Powell say 3 x 0.50% interest rate hikes (next 3 meetings). So, this takes us to 2.5%. To us, this is neither bullish nor bearish. It is a 7-iron shot down the center of the fairway on a par 3. You don't swing for the green, and a chance for a 2. You lay it up nice and easy, guarantee yourself a 3 or 4, and eliminate the risk of missing the green entirely and ending up way over par. We are forecasting (so dangerous) a year-end interest rate of 2.5%, and a total quantitative tightening (or reduction in total assets held by the Fed) of $1T by year-end. This gets us to pre-COVID levels. Today's Fed action is consistent with that forecast.
It's noon CT and the FOMC press conference and press release are a few hours away. I wanted to share something insightful from the top of the FINVIZ homepage. It opened my eyes, and want to share with you.
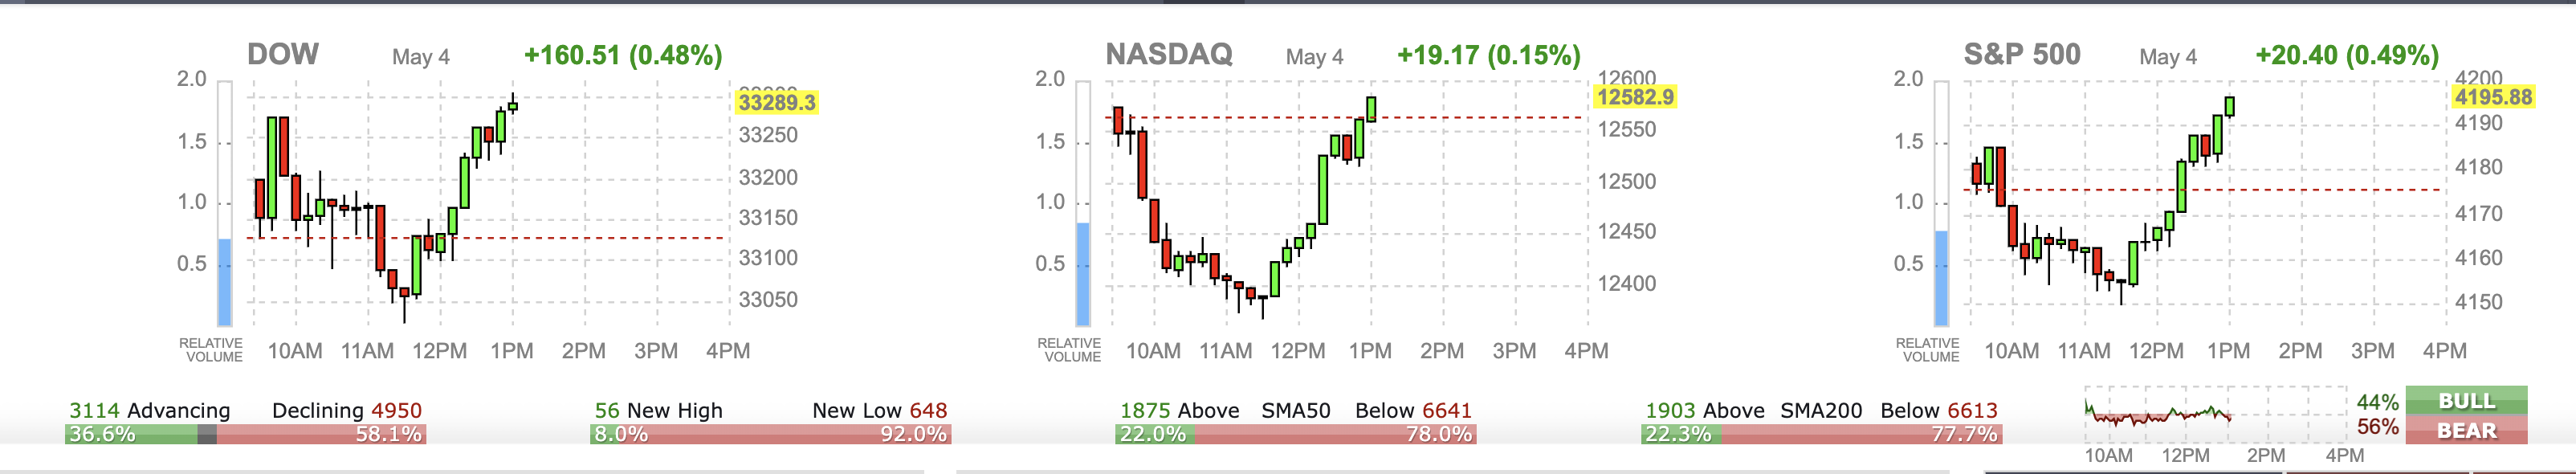
You can see the market went up, then down, then up. These are pretty big swings today, around 1.0 to 1.5% down, then up ~1.5%. Our intuition is that big money is betting in derivatives, options, futures and ETF that bet on the direction of the three major US indices, the S&P 500, the NASDAQ Composite 100 and the Russell 2000.
It is the five little bars below the indices that we noticed today. 1. 37% advancing vs. 58% declining. This means more stocks fell today than rose, even when the indices are up. This indicates that individual stocks are not broadly participating in the rise. They might by the end of the day if the indices stay higher, because money has to be invested from passive funds, but then again the indices could fall as 'whales' unwind their bets for the day. 2. 8% new highs vs. 92% new lows. Stocks that are falling continue to fall. FOMO is a cost effective strategy in downtrodden stocks, it is ok to have fear, but to save your cash. Very few new highs or stocks climbing. 3. Above or below SMA50. What is SMA50? It is the simple moving average of the stock price over the past 50 trading days. We use 253 trading days in our model, and compare stocks against their 253 day SMA. So, 50 trading days is ~ 2.5 months, and it shows whether a stock has been rising or falling during that time. So, we see 22% of stocks are above their SMA50 and 78% are below it. This means that for every 100 stocks you might own, it is likely that over the past 2.5 months 78 have fallen in price. 4. Above or below SMA200. What is SMA200? It is the simple moving average of the stock price over the past 200 trading days. This is ~ 10 months of trading, and is a long time to track momentum. In this case, the answer is the same, with 22% of stocks above and 78% stocks below their 200 day moving average. This is probably a good indicator of whether retail or typical investors made money on their stocks, as they may hold stocks about a year. 5. Bullish or Bearish sentiment at that moment. This is running between 44% bullish and 56% bearish. Who can blame the bearish ones, when 78% of their stocks are below where they bought them. Hope you found this educational. Please check out the Finviz homepage often to keep up with these metrics. They represent market breadth, or how wide the gains or losses are in the market. Today, there is very little breadth present, as the indices are rising, but leaving most stocks behind. The little
We ran our models and looked at the pre-market action. Market is mixed and not finding confirmation either way (up or down). As a result, Fear Of Missing Out is a prudent strategy for downtrodden stocks.
In our opinion, a stock that is now down 50% will likely be down further in a week or two. It is prudent to wait. In terms of our overall picks, here is the tweet that says it all.
0 Comments
Leave a Reply. |
Stock Market BLOGJeffrey CohenPresident and Investment Advisor Representative Archives
July 2024
|
||
 RSS Feed