|
By Jeffrey Cohen, Investment Advisor Representative, US Advanced Computing Infrastructure, Inc.
May 12, 2022, 8:35am CT (market just opened) We have had two major downturns in the market over the past 20 years. The first was in 2007 - 2009 and we were alive and trading and investing at that time. We lived through it, although without any social media, so we just read the WSJ (seriously) and The Economist and The Chicago Tribune for our news. Market drops were learned about the next day, at about 8am if we had time, or mid-morning during coffee in the office. That downturn lasted over a year. It was a fundamental shift in market valuations. It changed things. The next downturn was when the COVID 19 pandemic hit in early 2020. This hit quickly and in a few months was over. These are our choices...a long steady drop and slow recovery, or a quick 'flash crash' and almost equally fast recovery. 
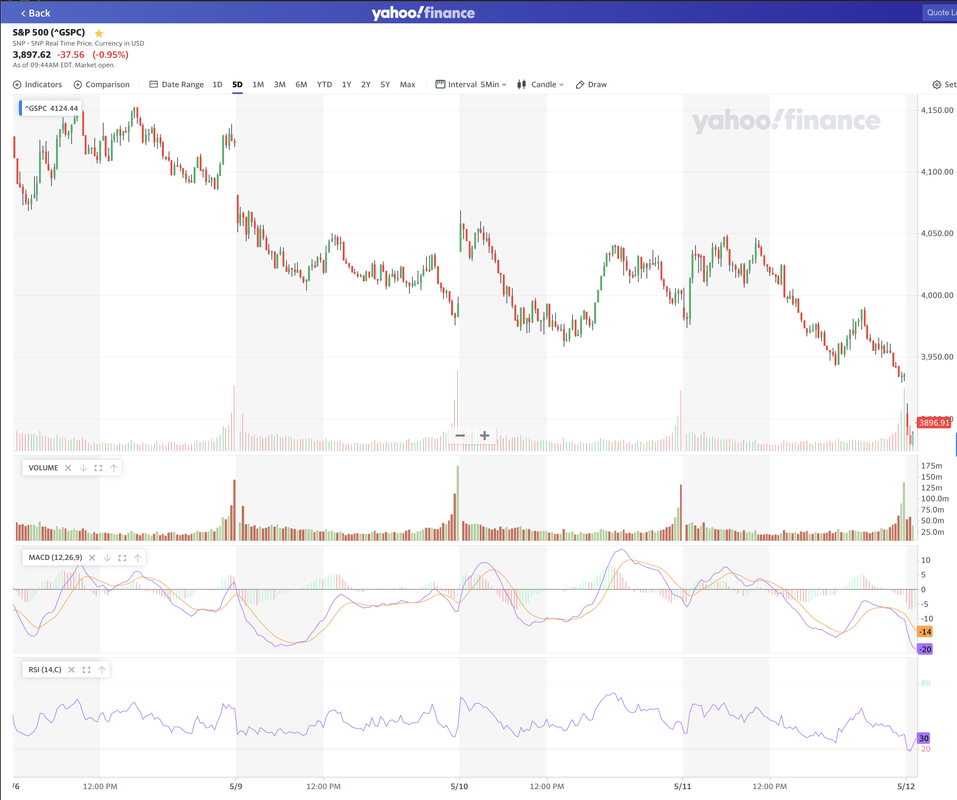
We do not have a functioning crystal ball, and our Magic 8 Ball has gone missing. We don't know what is in store for this market. However, we see 3 gaps at open in the past 5 trading days. This represents a significant movement, and interestingly not all gaps were down this past week.
We are learning a great deal in this market. We watch it every day, full time. This is our work now, we study the market, run models, do quantitative analysis, and manage a small portfolio. Sometimes we do more 'technical' things around quantum computing, but lately it has been 90% stock market and 10% quantum computing market. This ratio will change over time.
The variance of money losing company stocks is greater than the variance of money making company stocks by a factor of almost 3:1, and the variance of all 1,960 US listed profitable stocks that traded every day over the past year and had a market capitalization of over $500M (held evenly) had a variance of about 1/3 greater than the variance of the $SPY, or the S&P 500 Index ETF.
Expected return of money losing stocks is 6.56% and money making stocks is 4.95%. In a recession, more stocks slip from positive to negative net income. This means they lose money, their prices fall, their variances rise (so they trade more & lower). Their expected returns are higher if you bought it after it lost money. Also, the CQNS power of our model is below 3%, which means our model is working very hard to find ways to reduce variance because the expected returns go down. The $SPY is still a very risk-efficient way to hold exposure to the stock market. We see something strange in the yields on 10-year US Treasury Bonds. The prices of those bonds are up all week, and the yields are down. In fact, this morning the yield dropped 6 basis points to 2.861%, when inflation is running over 8%. 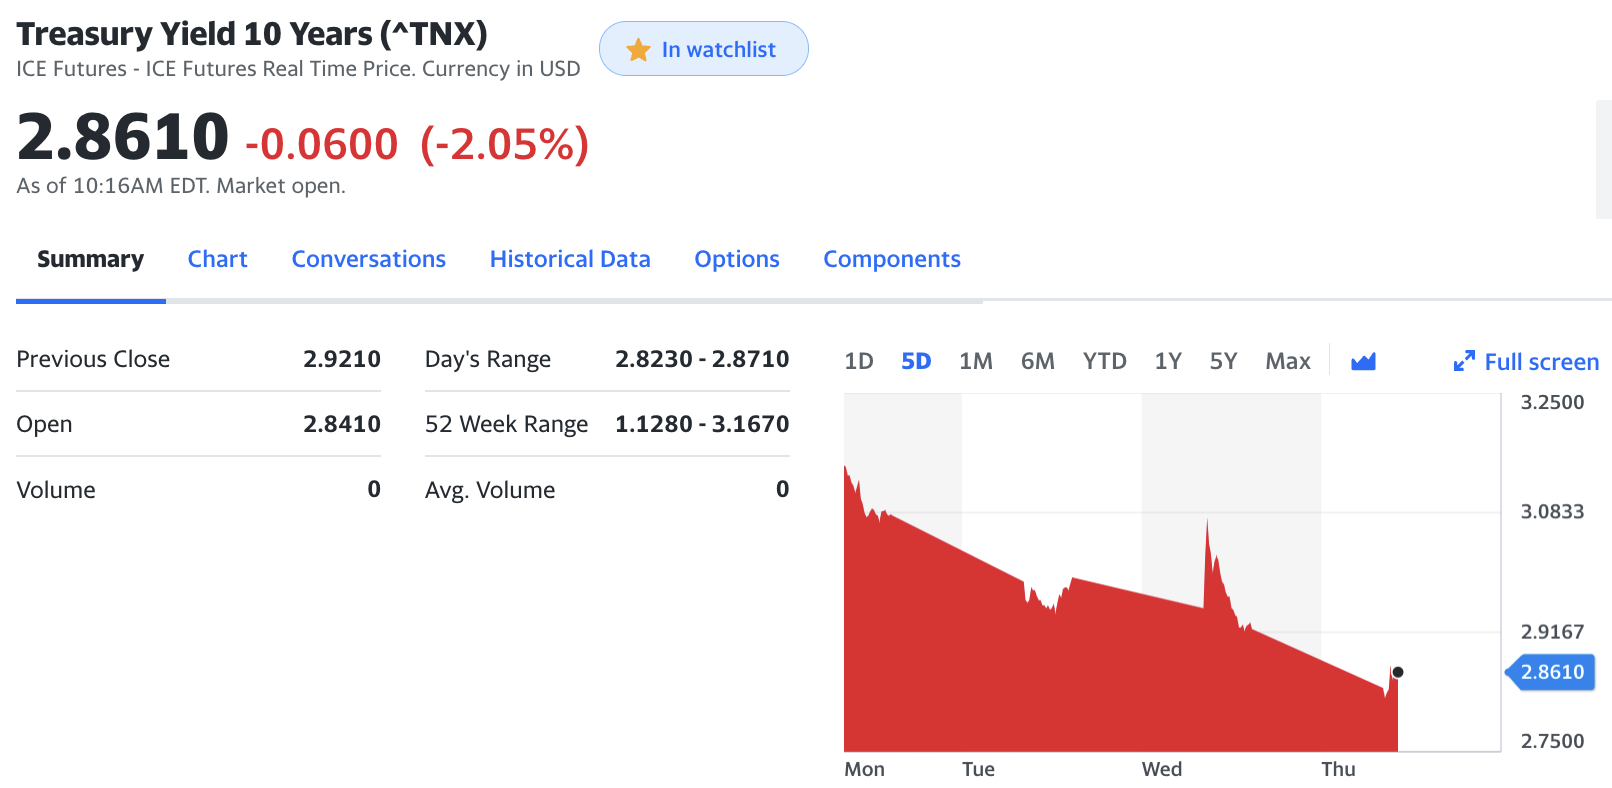
Negative BETA stocks remain in the market, but there are fewer of them. One notable exception is $K or Kellogg. This is a cereal company, and likely they are able to raise prices and keep ahead of inflation.
Reminder, we don't bet short, or profit when the market falls. We don't bet against the market.
We found something intentional about the fall in stocks that are already down. Their level of net income in the most recent SEC filing matters. The data may have a lag due to overhead by our market data services provider.
Positive net income stocks that are down the most over the past year have a mix of high and low volume trading levels yesterday when compared to the average over the past year. There is a mix of blue and yellow (blue have >2x volume, and yellow have <1/2 volume). This appears to continue over the ~200 stocks with the largest declines in both lists. Positive net income stocks have a mix of high volume and low volume action. Negative net income stocks only have positive volume, sometimes punishingly high volume of 10x or more, and so their price drops appear intentional and driven by conviction. The contract is stark and clear. If you are holding stock in a negative net income company that has already fallen, you should assume the selling pressure, including shorts, are coming for your stock further. If you have profitable stocks, there is a chance the market will overlook your company. This could have something to do with debt and leverage, and the risk of bankruptcy of companies in recession. This is some of the data behind our concept of FOMO: A Cost Effective Strategy (in today's market). 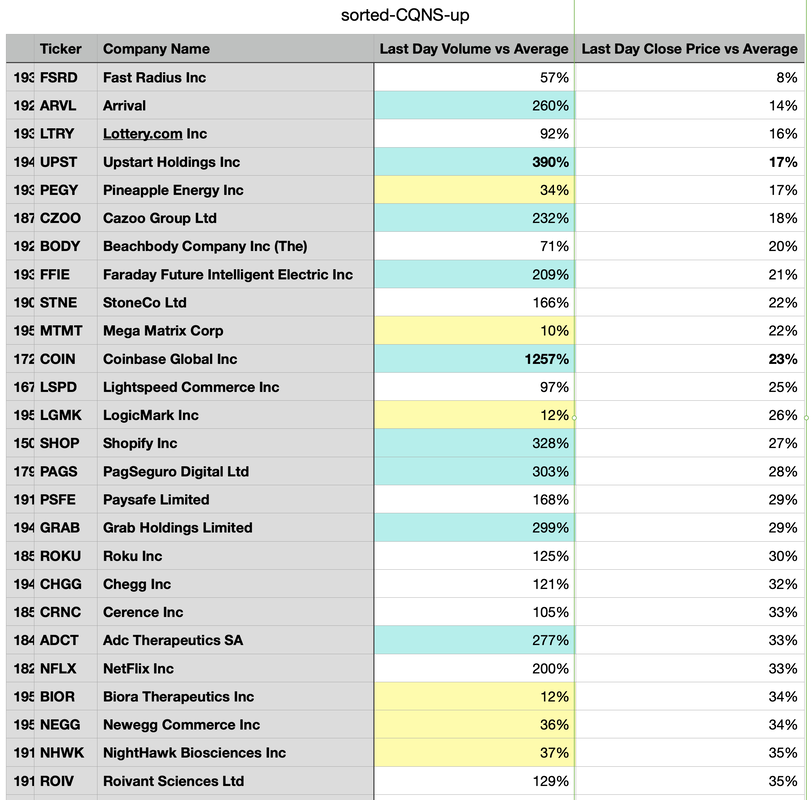
These are stocks with positive net income (blue is higher volume, yellow is lower volume)

These are stocks with negative net income (blue is higher volume, yellow is lower volume)
Finally, we dig into inflation data and our magic equation that describes inflation in the USA: M*V = P*T. Net-Net: The US Treasury Department is doing a little to control inflation, but the Federal Reserve Bank is not. If we can promote US economic activity, we can still grow our way out of inflation (but it would require 8% more economic activity).
0 Comments
Leave a Reply. |
Stock Market BLOGJeffrey CohenPresident and Investment Advisor Representative Archives
July 2024
|
 RSS Feed