|
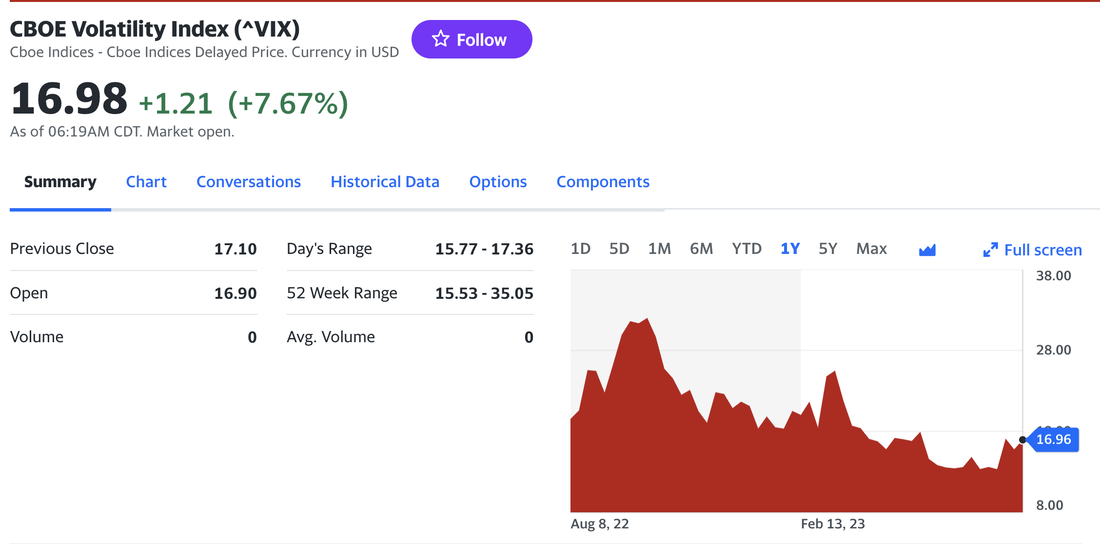
By Jeffrey Cohen US Advanced Computing Infrastructure, Inc. Top 10 list: 1) SPY variance continues to fall, and is now 2.6 x 10⁻⁵ (it was 3.5, then 3.2, then 2.7 not long ago). --- Did you know the VIX, or the building block of cost of insurance against market swings, has risen lately despite actual volatility being lower? 2) Expected equity market return to risk is 5.57%, with somewhat conservative settings. That is low. -- Did you know the Russell 2000 ETF is only up 3.78% (excluding dividends) from a year ago? 3) The risk-free rate of return on US monies is now 5.5%, so you can earn while you wait. Supposedly, this is higher than US inflation so you are earning a real rate of return. 4) There are still over 100 foreign companies listed on the US stock exchange. Ages ago, we found that these stocks had greater volatility without a commensurate rise in expected returns so we recommended against investing in foreign companies listed on US exchanges to avoid excess risk. In a bear market we expect these companies to fade or fall faster. Anecdotally, this was not true with Canadian companies listed in the US. A long time ago, Canadian stocks dominated our Chicago Quantum Net Score. Foreign companies are for savvy investors who want to incorporate arbitrage on foreign corporate law, currency, political risk and both fiscal and monetary policy, and are willing to pay with higher price volatility. 5 - preamble) We set our minimum market capitalization at $200mm and daily trading volume at 20k shares to avoid ultra-small capitalization and thinly traded companies. We evaluated 2,663 US listed common stocks (and a few ETFs for comparison) today. 5) Despite expected returns being down, the systematic risk, or market return multipliers based on correlation to the US equity market, drives total expected returns to equities to 12.11%. This is pretty high, and is based on individual stock price volatility exceeding the price volatility of major indices. In fact, the expected return of individual stocks ranges from 5.54% to 26.71%. Those are expected returns based on systematic risk of individual stocks, and drives differences in valuation. We are willing to pay more (in risk) for higher expected returns. 6) The CQNS Power of our run is 4.76. This means expected returns outweigh risk by a wide margin. The variance of a portfolio of 2,663 US listed common stocks, equally weighted, is 4.35 x 10⁻⁵, versus 2.6 x 10⁻⁵ for the $SPY ETF. In other words, the value / benefit of investing in the S&P 500 is significant in reducing investor risk. Individual stocks are much more risky, evan as a universal basket of stocks. However, we are concerned that the concentration of massive amounts of investor wealth in a few highly valued names (e.g., Apple, Microsoft, Amazon, Google, Nvidia (all valued over $1T), META, Tesla, Berkshire Hathaway, United Healthcare, JPMorgan J&J, Visa, Walmart, Exxon and Lilly(Eli) (all valued over $400B) creates fragility in the market. Drug & Energy companies can be crippled with a tax hike. Technology and eCommerce suffer when interest rates rise and economic activity falls. Any individual stock can be impacted by the actions of a single corporate executive. 7) A handful of individual stocks look very good in this market. We see 14 stocks with a better, individual risk-return than the $QQQ, 15 better than the $SPY, and 17 better than the $IWM. In a 'normal' market, these equity index ETFs score better than individual stocks. Logically, diversification should work. However, in this market, individual stocks like $AFRM are scoring consistently better than the overall market when comparing risk vs. expected return. 8) MEME behavior. Yesterday, we saw 8 stocks that we had never heard of trade 10x last year's average daily volume of shares. We also have 13 stocks with a BETA of 3.0 or higher. This is amazing and requires real work on behalf of market makers and stock market participants. These stocks rise or fall 3x more than the overall market, pretty much every day, over the past year. That is a very high level of activity to maintain, and requires significant liquidity. These stocks are seeing reduced volume vs. last year, and show significant long-term debt and negative income (except $APPS Digital Turbine, which shows a small profit) in our professional Market Data Services, provided by Intrinio. We appreciate the hard work by the Intrinio team. 9) There are market anomalies that persist in our data. These could just be random fluctuations in the system, but some of them seem to persist for as long as we have been looking.
--- There are 15 stocks with excessive positive skew, and 23 with excessive negative skew --- There are 8 stocks that are Leptokurtic and low variance, and 10 are Platykurtic and low variance. 10) The best portfolio to hold is one stock. $AFRM or Affirm Holdings. You give up 20% of your edge by adding NVTA or Invitae Corp, or just a tiny bit more to hold 5 to 8 stocks. These are not stocks that we would consider 'blue chip' and include stocks like Select Quote $SLQT or $OPEN Opendoor Technologies Inc. Our model is picking just a few very high risk stocks in companies that lose money. At the end of making this list, we are less optimistic than ever that the US equity market as it stands today will persist, and that pricing and volume action will change. We will change first, and are changing our run accordingly to help get ahead of this 'broken market.' Good luck to all. Make money! Jeffrey Cohen, President and Founder US Advanced Computing Infrastructure, Inc. August 8, 2023 at 0821 ET
0 Comments
Leave a Reply. |
Stock Market BLOGJeffrey CohenPresident and Investment Advisor Representative Archives
July 2024
|

 RSS Feed
