|
We are studying US consumer dynamics on spending, income and savings. We notice that consumers are not growing their income significantly, and they are spending more, which reduces the US national 'consumer' savings rate.
We found six categories, and compiled the underlying data.
Energy: Gasoline and other energy goods: -$6B (fuels, lubricants and fluids) Natural gas: -$2.8B Transportation: Foreign travel by U.S. residents: -$3.4B Parking fees and tolls: -$349M Other road transportation service: -$278M Postal and delivery services -$166M Taxicabs and ride sharing services -$145M Moving, storage and freight: -$107M Cars, Trucks and Vehicles: New light trucks (purchased): -$2.44B Used Autos (purchased): -$684M Auto leasing: -$326M Motor vehicles and parts: -$312M Truck leasing: -$192M New domestic autos: (purchased) -$115M Other recreational vehicles (purchased): -$156M Motorcycles (purchased): -$60M Miscellaneous Services: Funeral and burial services -$1.5B Cable, Satellite and other live television services $1.44B Other imputed indirect securities commissions (hidden commissions): -$414M Medical laboratories: -$397M Sins and Charities (discretionary): Casino Gambling -$1B Professional advocacy -$986M Personal remittances in kind to nonresidents: -$94M Tobacco: -$85M Home Decor: Carpets and other floor coverings: -$120M This suggests that a few areas of the economy are seeing weakness, and this could impact an investor’s choices. For example, we discount changes in energy and transportation costs unless they repeat for a few months, but we welcome the boost to the overall US economy. We suggest gambling, tobacco, cable and satellite TV, and funeral homes are likely weak areas to invest in the short term. For automotive makers (cars and light trucks), and recreational vehicles, this is an early sign of weakness which should be tracked into August and September when the new 2024s start to hit the market. We hope you enjoyed this post and found it useful. I am Jeffrey Cohen, President of US Advanced Computing Infrastructure, Inc. We are a quantum computing consultancy and investment advisory firm. For more information, visit our website here. There are around 300 unique categories of spend that are tracked and reported monthly by the US Department of Commerce here. Although total spend increased $144B from June to July 2023, we were interested in where consumers were cutting spending. We downloaded that data in a .csv at 11am ET on August 31, 2023.
0 Comments
Dollar General issued a press release today, August 31, 2023, which had 19,488 stores as of August 4, 2023.
"Same-store sales in the second quarter of 2023 included declines in each of the home, seasonal, and apparel categories, partially offset by growth in the consumables category." "This gross profit rate decrease was primarily attributable to lower inventory markups and increased shrink, markdowns, and inventory damages, as well as a greater proportion of sales coming from the consumables category, which generally has a lower gross profit rate than other product categories. These factors were partially offset by a lower LIFO provision and decreased transportation costs." In the first, we see that the US consumer, typically those at the lower end of the income curve, were shifting their expenditures to consumables like food. In the second, we see that Dollar General had to lower their prices, and suffered from destruction and theft of their inventory. This is on a growing inventory base (up 3.4% on a comparable store basis over the past 12 months). We heard similar news from Dollar Tree on August 24, 2023 who have 16,476 stores as of July 29, 2023. "Dollar Tree same-store sales increased 7.8%, driven by a 9.6% increase in traffic, partially offset by a 1.6% decline in average ticket. Family Dollar’s 5.8% same-store sales increase was comprised of a 3.4% increase in traffic along with a 2.3% increase in average ticket." "The gross margin decline was driven by lower initial mark-on, unfavorable sales mix, elevated shrink, and wage investments in distribution center payroll, partially offset by lower freight costs." The first point confirms that the consumer was more focused on consumables, which make up a larger portion of Family Dollar sales than for Dollar Tree. The second point confirms that the sales mix is changing to lower margin items and there is an increase in inventory shrink. Dollar Tree did manage to lower its inventory levels, but is 'paying' for that efficiency with greater investments in logistics labor. In conclusion, the lower income consumer is shifting their spend to consumables, and helping to shrink inventory levels at the 'value' stores designed to serve them. By Jeffrey Cohen US Advanced Computing Infrastructure, Inc. Chicago Quantum SM Consumer spending grew significantly faster than disposable personal income in July. According to the US Commerce Department (here) personal income increased $45B (0.2%) while consumer spending increased $145B (0.8%), and personal savings was 3.5% of disposable personal income. In short, the consumer fell $100B behind in July. Put another way, when accounting for inflation personal income was flat (0.0%) in July, but personal consumption expenditures rose 0.6%. Consumers were not just keeping up with inflation, as they grew spending 3x to 4x faster than prices rose. In short, they spent more, and they grew spending more than they grew their income. 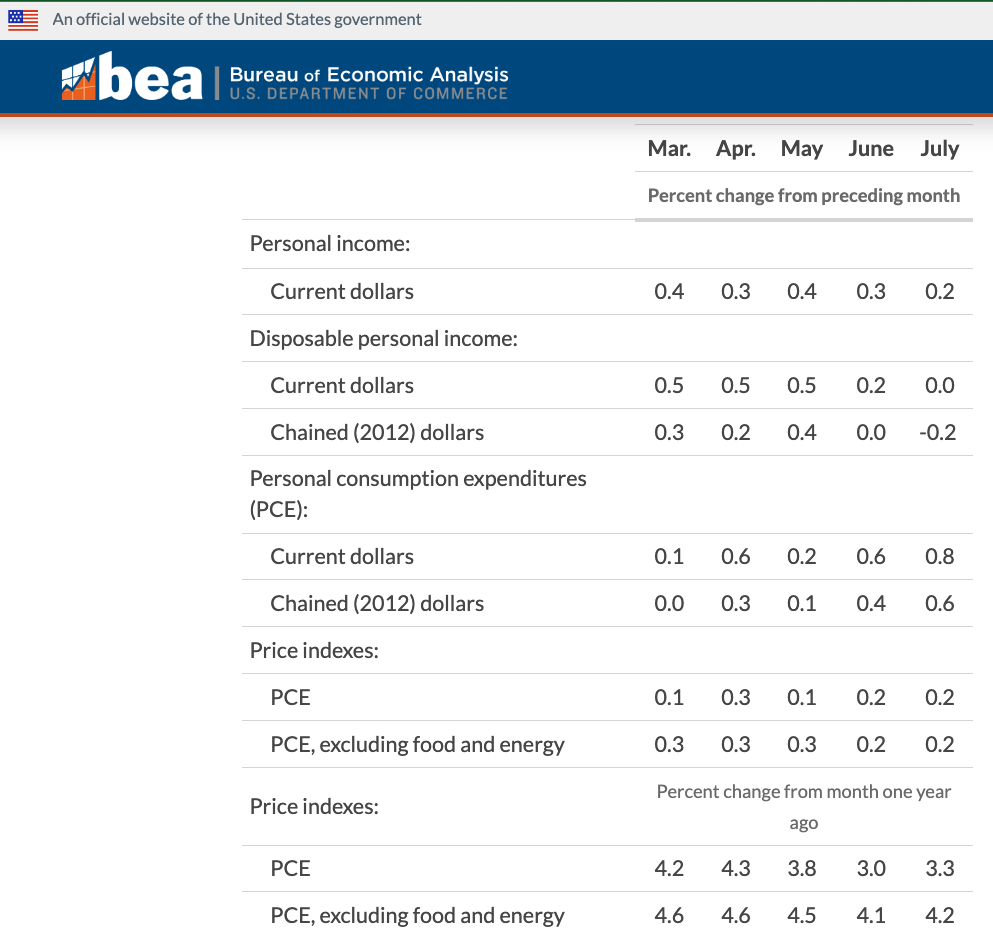 We also saw downward revisions to consumer's growth in personal income for both May and June of 2023, by a combined $20.5B. US consumer income growth was slightly weaker than we thought. 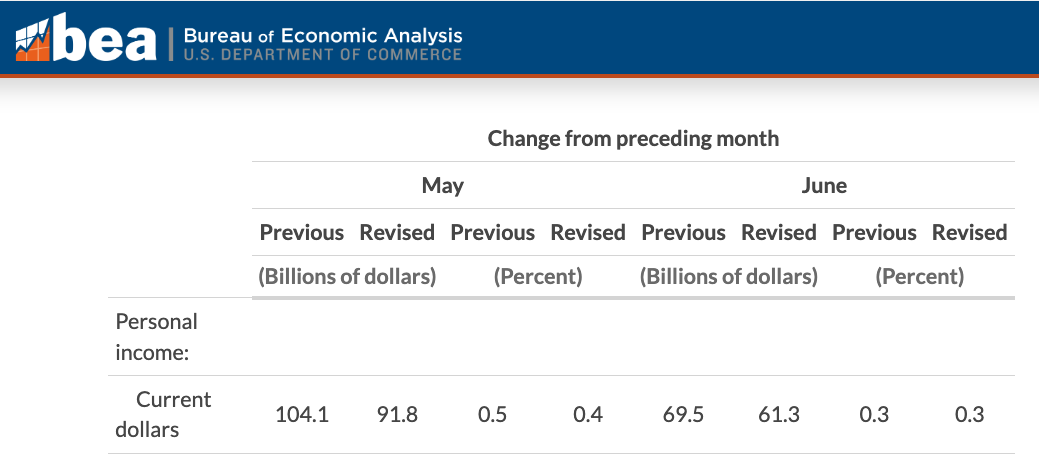 In the totality of the data, we see that the US economy continues to grow based on increases in personal consumption for every month in 2023. Our question is regarding where the money is coming from to pay for those purchases, and whether the consumer is taking on unhealthy levels of credit. Only time will tell.
By Jeffrey Cohen, President and Founder, US Advanced Computing Infrastructure, Inc. We made changes to our model yesterday, analyzed the results, and wrote three Medium articles.
Today, we are making further revisions. What are we changing? 1. In our last UP run, we ended up with 25% of stocks passing data validation and our filters. We now realize those were stocks with leverage and not without leverage. We fixed that code and are re-running the model. 2. We are also testing for both positive and non-trivial common equity (or book value). We avoid stocks where the liabilities outweigh the assets, as that creates a different type of leverage that is similar to debt. An unleveraged company maintains ownership of a meaningful portion of the assets they need to operate their business. 3. We eliminated the test for positive and non-trivial cash flow from operations as this is largely captured in the net income test. Model is running now. Let's see what happens! We wrote and published these three articles on Medium today. Hope you enjoy them.
They are based on primary research, a new variant of our Chicago Quantum Net Score, and were motivated by gut feel and intuition over the past few weeks. We are changing our investing style to incorporate them. We hope you find them valuable. Most of the points appear to be common sense, but it is how we put them together that has the impact we are looking for. By Jeffrey Cohen President & Founder US Advanced Computing Infrastructure, Inc. So, I was walking through the data and "POW" I was hit in the face by a strange fact. There are many companies with negative book value (or common equity). Taken at 'face value' this means that the companies are bankrupt once they really look at it. Their liabilities exceed their assets. For example, $TUP Tupperware Brands Corporation has negative common equity of $175.4mm, market cap of $252mm, and debt of $688mm. My guess is their assets are worth in the ballpark of $500M. They lose money (negative net income) and lose money off the books (AOCI is negative), so I don't see how they will ever pay back that debt. Taken at a conservative yield of 12% for high yield junk debt, this debt will cost them $82M / year, and no tax shield, so they really do spend that. So, unless the market for sealable plastic containers I buy at Dollar Tree $DLTR sees exponential growth, their fate is sealed, and they will likely have to restructure. So many more examples. If we remove stocks from the 2,663 included in last night's analysis that have negative common equity, then 189 companies drop out. This leaves us 2,474 stocks remaining with positive common equity. Is there a valid ratio for market capitalization vs. common equity? The ratio ranges from less than one (actually around 0.1 or 10% of book value), and up to 6,749 or 674,900% of book value for $CLX or Clorox Co. A windsorized range (~5% off each end) is (0.73, 14.7). The typical US equity trades at somewhere between 73% of book value and 1,470% of book value). It seems to me that logically, we should be valuing companies by taking into account their book value, and their earnings. That does not seem to be the case with Clorox, which has a market capitalization of $20.2B, common equity of $3mm, net income of $84mm, and negative comprehensive income of $414mm. Tyson Foods, or $TSN, is in roughly the same valuation range with a tiny common equity of $45mm, a market capitalization of $19.2B, and comprehensive earnings of $1.5B, although earnings fell the most recent quarter and may not be reflected in our annualized data. Assuming our premium market data services balance sheet and income statement data is correct, and we have not checked it, we see a real question. Why do companies run so lean? Why do companies maintain an 'asset light' positioning where they match assets to liabilities? Why doesn't the market punish those companies with lower equity valuations? On the flip side, there are companies with significant amounts of assets, well in excess of liabilities, but they are valued very little above their assets? In fact, many companies are valued below their net assets, or book value, and in theory are worth more dead (or taken through BK) than alive. We don't know the answer to this weighty question, but it is worth further reflection. In addition, we are not sure we would remove companies from evaluation just because they are asset light, or even hold negative net assets. It is just a different way to invest. We see another question. Why do companies trade below their book value? Other companies trade at a discount to book value. $C Citigroup Inc. and $X United States Steel Corp. are two examples of companies that trade at around half of book value. However, Citigroup lost $32.2B on a comprehensive basis last year (ouch), while United States Steel made $1.26B on a comprehensive basis. Accounting for leverage from debt, Citigroup carries a debt to equity ratio of 3.0, while USX is 0.77. If you believe in the power of numbers, US Steel looks like a steal. The question is then about whether those assets can be sold or monetized for their book value. A steel mill, especially during a recession, is probably not easy to sell. Companies are reducing production and shuttering mills. For Citigroup, the answer is likely much more complex as those assets may contain illiquid investments like derivatives, options, stocks, foreclosed collateral, and private equity stakes. During an economic downturn, those assets may be close to worthless (as they were in the Great Financial Crisis of 2007 - 2010). After thinking this through, I am not sure we would include or eliminate a company based on its common equity. It is too complicated to just say, book value = market value. So, we leave our analysis as-is as it relates to book value ratios. 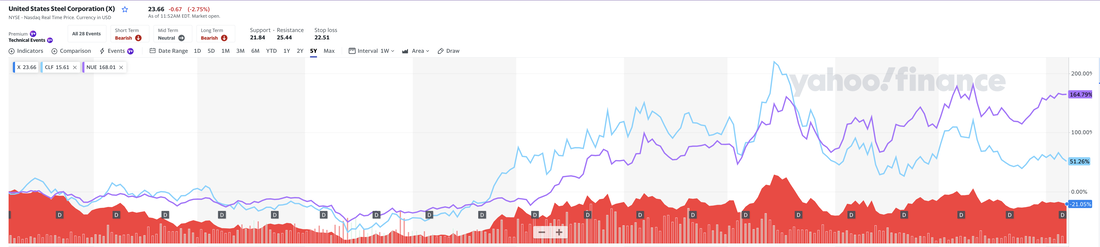 In the chart above, we compare US Steel Corporation (red) against two major competitors, $NUE Nucor (purple line, 2.24x market cap / common equity) and $CLF Cleveland Cliffs (blue line, 1.06x). Being 'cheap' relative to book value might be an inverse indicator. Nucor has the highest valuation relative to their net asset position (or common equity), and that valuation continues to grow more quickly. Cleveland Cliffs is in the middle for both valuation and increase. In short, Nucor isn't 'cheap' but it has been the best investment over the past 5 years.
Jeffrey Cohen President and Founder US Advanced Computing Infrastructure, Inc. We ran our Chicago Quantum Net Score model last night. 2,663 common stocks of operating companies listed on US equity exchanges (think NASDAQ and NYSE) passed our test for data validation and sufficient size/liquidity to ensure they can be traded. That number includes about a dozen ETFs we include to allow for comparisons against indices and alternative investments (think debt, a few currencies, and select commodities).
The two most restrictive 'covenants' were that stocks had to trade at least 20,000 shares per day and to have a market capitalization of $200mm or more yesterday. We also exclude negative BETA stocks, of which there were maybe a dozen. So, 2,663 stocks were included in our model. The 'best' ones have relatively low risk to expected return (mostly due to high BETA or high historical dividends), and some of the best ones seem to have price action that keeps them looking good over an extended period of time. They move with the market, maintain strong correlation to market moves, and have lower price volatility than we would expect. A 'winning' Chicago Quantum Net Score portfolio today has between 1 and 8 stocks, and those stocks are not household names. They are anomalies. They are new economy stocks that lose money (except one) and have significant debt. We are not sure this is where we want our clients, investors or friends to be investing anymore. Sure, we can all make money counting on the market makers to keep things rolling as they are, and to short the dogstar stocks, but I am rethinking things. I am surprised that the best stocks in our model lose money and have significant debt. That corporate debt is getting more expensive to service as sovereign UST and foreign debt becomes more expensive. We just saw Yellow Corporation file for bankruptcy based on rising expected, future wage costs, a 'must-do' corporate restructuring that was foiled by a union negotiating move targeted at UPS, and around $1.5B in debt. If we remove the negative Net Income companies from our analysis, we drop from 2,663 to 1,793 stocks. If we account for companies with negative AOCI or Additional Other Comprehensive Income, which is not included in Net Income, and subtract that from earnings, we drop from 2,663 stocks to 1,465 stocks. This accounts for things like companies holding investments that lost value, but do not have to be shown in net income. As interest rates rise, the value of most bonds fall, and those losses are accounted for here. I think other things like interest rate swaps, hedges, and contingent losses go here. I like to account for AOCI. This is my 'thing' and it eliminated another 328 companies from the list of profitable companies. Now, here is the hard part. How much debt is too much for a company with at least $200mm in market cap? We could look at a multiple of market cap to get a sense of leverage and ability to repay debt with equity sales. We can look at a multiple of annual earnings to get a sense of leverage and ability to pay off debt with earnings. Apple can carry more debt than Pollo Loco. A Long Term Debt to Equity Ratio of 4 limit is very loose, and only eliminates 39 companies with an equity market capitalization of at least $200mm. A Debt to Equity limit of 3.0 (or lower) is also loose, eliminating only 59 companies out of 2,663. We will stick with a D/E of 3.0. A Long Term Debt to Comprehensive Income that is positive, but is less than 20x seems extremely loose logically, but eliminates 1,628 companies from our run. Lowering the limit to 15x eliminates another 69 companies, and lowering the limit to 10x eliminates another 111 companies. In the end, the only 'filter' we need to set in python is that a company has 10x or lower multiple of debt to comprehensive earnings, and we are in a world of profitable companies with conservative Debt to Equity ratios. That filter eliminates 68% of companies. By Jeffrey Cohen US Advanced Computing Infrastructure, Inc. Top 10 list: 1) SPY variance continues to fall, and is now 2.6 x 10⁻⁵ (it was 3.5, then 3.2, then 2.7 not long ago). --- Did you know the VIX, or the building block of cost of insurance against market swings, has risen lately despite actual volatility being lower? 2) Expected equity market return to risk is 5.57%, with somewhat conservative settings. That is low. -- Did you know the Russell 2000 ETF is only up 3.78% (excluding dividends) from a year ago? 3) The risk-free rate of return on US monies is now 5.5%, so you can earn while you wait. Supposedly, this is higher than US inflation so you are earning a real rate of return. 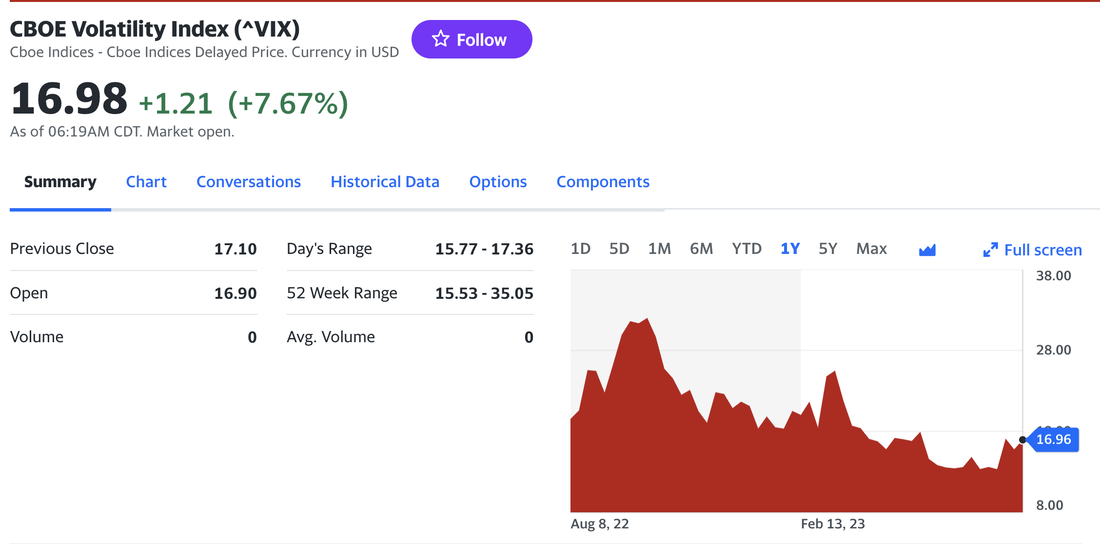 4) There are still over 100 foreign companies listed on the US stock exchange. Ages ago, we found that these stocks had greater volatility without a commensurate rise in expected returns so we recommended against investing in foreign companies listed on US exchanges to avoid excess risk. In a bear market we expect these companies to fade or fall faster. Anecdotally, this was not true with Canadian companies listed in the US. A long time ago, Canadian stocks dominated our Chicago Quantum Net Score. Foreign companies are for savvy investors who want to incorporate arbitrage on foreign corporate law, currency, political risk and both fiscal and monetary policy, and are willing to pay with higher price volatility. 5 - preamble) We set our minimum market capitalization at $200mm and daily trading volume at 20k shares to avoid ultra-small capitalization and thinly traded companies. We evaluated 2,663 US listed common stocks (and a few ETFs for comparison) today. 5) Despite expected returns being down, the systematic risk, or market return multipliers based on correlation to the US equity market, drives total expected returns to equities to 12.11%. This is pretty high, and is based on individual stock price volatility exceeding the price volatility of major indices. In fact, the expected return of individual stocks ranges from 5.54% to 26.71%. Those are expected returns based on systematic risk of individual stocks, and drives differences in valuation. We are willing to pay more (in risk) for higher expected returns. 6) The CQNS Power of our run is 4.76. This means expected returns outweigh risk by a wide margin. The variance of a portfolio of 2,663 US listed common stocks, equally weighted, is 4.35 x 10⁻⁵, versus 2.6 x 10⁻⁵ for the $SPY ETF. In other words, the value / benefit of investing in the S&P 500 is significant in reducing investor risk. Individual stocks are much more risky, evan as a universal basket of stocks. However, we are concerned that the concentration of massive amounts of investor wealth in a few highly valued names (e.g., Apple, Microsoft, Amazon, Google, Nvidia (all valued over $1T), META, Tesla, Berkshire Hathaway, United Healthcare, JPMorgan J&J, Visa, Walmart, Exxon and Lilly(Eli) (all valued over $400B) creates fragility in the market. Drug & Energy companies can be crippled with a tax hike. Technology and eCommerce suffer when interest rates rise and economic activity falls. Any individual stock can be impacted by the actions of a single corporate executive. 7) A handful of individual stocks look very good in this market. We see 14 stocks with a better, individual risk-return than the $QQQ, 15 better than the $SPY, and 17 better than the $IWM. In a 'normal' market, these equity index ETFs score better than individual stocks. Logically, diversification should work. However, in this market, individual stocks like $AFRM are scoring consistently better than the overall market when comparing risk vs. expected return. 8) MEME behavior. Yesterday, we saw 8 stocks that we had never heard of trade 10x last year's average daily volume of shares. We also have 13 stocks with a BETA of 3.0 or higher. This is amazing and requires real work on behalf of market makers and stock market participants. These stocks rise or fall 3x more than the overall market, pretty much every day, over the past year. That is a very high level of activity to maintain, and requires significant liquidity. These stocks are seeing reduced volume vs. last year, and show significant long-term debt and negative income (except $APPS Digital Turbine, which shows a small profit) in our professional Market Data Services, provided by Intrinio. We appreciate the hard work by the Intrinio team. 9) There are market anomalies that persist in our data. These could just be random fluctuations in the system, but some of them seem to persist for as long as we have been looking.
--- There are 15 stocks with excessive positive skew, and 23 with excessive negative skew --- There are 8 stocks that are Leptokurtic and low variance, and 10 are Platykurtic and low variance. 10) The best portfolio to hold is one stock. $AFRM or Affirm Holdings. You give up 20% of your edge by adding NVTA or Invitae Corp, or just a tiny bit more to hold 5 to 8 stocks. These are not stocks that we would consider 'blue chip' and include stocks like Select Quote $SLQT or $OPEN Opendoor Technologies Inc. Our model is picking just a few very high risk stocks in companies that lose money. At the end of making this list, we are less optimistic than ever that the US equity market as it stands today will persist, and that pricing and volume action will change. We will change first, and are changing our run accordingly to help get ahead of this 'broken market.' Good luck to all. Make money! Jeffrey Cohen, President and Founder US Advanced Computing Infrastructure, Inc. August 8, 2023 at 0821 ET By Jeffrey Cohen President, US Advanced Computing Infrastructure, Inc. We have been running our Chicago Quantum Net Score for the past few weeks and are seeing the same types of results, although the specific stock names are different.
We see overall stock market price variance lower than before. Lower price variance usually coincides with a greater desire for investors to hold equities. We also see the larger capitalization US Equity indices higher, although the run up seems to have stalled recently. There was significant bullish activity earlier, and now that move is being digested in the market. Finally, our most attractive stocks, those who have market power in excess of their price risk, we see ecommerce companies, new economy stocks, and bitcoin stocks, along with the occasional turn-around or growth story stock. In other words, our model is ranking small and mid-cap stocks with a growth story higher than traditional, large-cap companies. The best 50 individual stocks have a maximum market capitalization of $38.7B, and many are under $1B. Unfortunately, a few of those stocks are also in free-fall, where their movement greatly outweighs the variance of the moves, because previously we saw them shooting higher as well. Many of these stocks have a story to tell, either of transforming back to profitability, or in capturing huge total addressable markets (TAMs). On the down side, we see old MEME stocks and highly risky stocks that are (at sight) almost uniformly moving without profits. These are stocks with a story and a dream...but nothing else. So, these stocks rise and fall with market trading (movement each day, but limited overall direction with the S&P 500. Many familiar names, but new ones too. Finally, the best few stocks in our Chicago Quantum Net Score run outperform the rest, and dominate the best CQNS long portfolios. To look at the names and chart action, you would not know these are the best stocks to buy and hold. However, the model says they have a high degree of market power and will rise if the market rises, far in excess to the riskiness of their typical price movements. By Jeffrey Cohen, President, US Advanced Computing Infrastructure, Inc.
As a result, we are running our model tonight to bring in lots of small caps, and under $1.00 stocks to see if the model likes runners, or MOMO stocks, and even those that are small or micro-capitalization. Our model is starting to pick risky, new economy stocks over the tried and true. It suggests smaller portfolio sizes with more concentrated risk in those very same risky stocks. Why? It's simple: 1. the market is going up 2. the market has lower risk right now (put another way, lower price volatility). So, you get earnings with less risk. Sounds good to the Chicago Quantum Net Score. Short post today. Our model has a few stocks that it likes...over long periods of time.
They tend to have had high BETA values, and recently have low volatility. Therefore, they look like they can run wild when stocks rise, but also are very calm and safe bets. Today, Digital Turbine $APPS issues earnings and showed their business shrunk (was a growth stock) and they went from profit to loss on a GAAP basis. Stock dropped 46% today. When we run our model, we are using the 'math' behind stock movements, and not doing due diligence on stocks. This loss would have been catastrophic had it not been hedged. So, we suggest that at a minimum to eliminate positions in stocks that will have earnings releases. This way, these one-time events can be avoided, both on the positive and negative side. Good luck to all. May 16, 2023
Jeffrey Cohen, President US Advanced Computing Infrastructure, Inc. We analyze between 3,500 and 4,000 stocks each day. We look at the price volatility over the past year and use it in our calculations. We have seen those volatility numbers decline over the past weeks. What this means is that our model is 'promoting' economically sensitive stocks, and smaller portfolios. Why? Because the expected returns of stocks is outweighing the cost of risk. This week we lowered the expected return of stocks (forward looking for the next 12 months). Normally, this makes our model more conservative. It did not this week. The model continues to 'crunch' the data on price variance for stocks, and it makes risky stocks more attractive. By Jeffrey Cohen
President, US Advanced Computing Infrastructure, Inc. I received a request from a Twitter follower for an analysis of Corbus. I will produce this, and share it with membership, upon request. I no longer own this equity. This would be provided as an investment advisor. We prepared a detailed analysis of Rigetti Computing. This analysis will be made available to members of our firm (for a monthly fee of $250) upon request.
We completed our analysis of ATI Physical Therapy's Transaction Support Agreement signed and announced on April 17, 2023.
Members of our firm (subject to paying a $250/month membership fee) are able to request and receive our analysis. By Jeffrey Cohen, President and Founder US Advanced Computing Infrastructure, Inc. We have traditionally given stocks 100% (this is a variable setting) credit for dividends paid. This means we assume that the day a stock no longer pays a dividend, also known as the ex-dividend date, its stock price will fall by the value of the dividend (ex-dividend date). Since our model is looking to find expected returns for stocks, we 'add back' the value of the dividend so the expected return is included.
During a time of stable pricing, low interest rates, and when dividends are scarce, this is a necessary adjustment. The difference between a stock paying a 2% dividend and one paying zero is immaterial, but imagine the master limited partnership (MLP) or the Real Estate Investment Trust (REIT) that could be paying 7% or 10% during a time could be very material. So, we gave back 100% of the value of the dividend to the 'future expected return' of each stock, and the model ran well, giving us a mix of dividend paying and non-dividend paying stock in the optimal portfolio. A few weeks ago, we removed a set of stocks that had 14% or higher dividend yields (actual dividends paid / average closing price). This week we added them back to the list. What we found is that the stock list has been dominated by common stocks that paid very high dividends in the past year, and where their stock price has fallen. This seems like a great idea, buy low and sell high, except that many of those dividends were likely one-time events. These were companies often enjoying a Covid-related windfall. In other cases, the dividend was 'normal' but the stock fell by a very large percentage, so that the previous dividend now looks enormous. This week, the stocks selected by the model in the optimal portfolio were dominated by companies that had paid a high dividend, and we are uncertain whether those dividends would repeat. We have turned off our dividend adjustment, and the stocks picked in our optimized portfolio still have risky stocks, but at least we don't have a dividend repeat risk. This week's CQNS Long portfolio has 12 stocks held evenly, and we will be watching that portfolio carefully to see if the market is acting like it is expecting a rise over the next year. We set our model to assume a 7.00% capital appreciation and a 1.63% dividend yield for all stocks (or a good proxy like 1/3 of each of the following: S&P 500, Nasdaq 100 and Russell 2000). Good luck to all. Episode 2: Make Smart Investments, f.t. $ATIP $YELL and $ATLX Savvy Investor:
1. Your first $10,000 per year goes into iSeries US Savings Bonds. This pays inflation plus 0.4%, currently 6.7% 2. Your next “some money” goes into 13-week US Treasury Bills. They paid (a week ago) 5.128% on a bond equivalent investment rate, or 4.85% flat rate. 3. Put the rest of your long-term investments into a highly diversified US equity fund or ETF (I use Vanguard F500), but you can also use Fidelity, Schwab, or others, or $SPY ETF. 4. Pay off all your debt. 100% of it. This way all the flow of interest is into your pocket, and you understand your financial position. You don’t over-spend. You don’t make consumption decisions based on what you can borrow, but based on what you have. 5. The market is very, very risk off. The edge of our CQNS model is only 11 ticks over $SPY. The price risk, or volatility, of individual stocks is much higher than the price risk of the diversified market of US equities. This is why we say risk-off, and suggest diversifying. This is why we are dipping or stretching for returns into high-risk equity investments like $ATIP $YELL and $ATLX short. We posted our first video in a few weeks. Hope you like it. The S&P 500 Equity Index ETF scores almost as well as the best risk adjusted portfolio we found.
Here is our best solution for US listed stocks that pass our data validation. This long portfolio was chosen from 3,394 common stocks. -0.000074 ['AAPL', 'ADP', 'AFCG', 'AFG', 'AGNC', 'AMBP', 'AMZN', 'ANSS', 'ARI', 'AVGO', 'BITO', 'BKE', 'CFFN', 'COST', 'CSCO', 'CVI', 'F', 'FAST', 'FTAI', 'GOOG', 'HPQ', 'INTC', 'INTU', 'LLY', 'MC', 'MFA', 'MSFT', 'NFE', 'OMF', 'OTEX', 'PFE', 'PKE', 'PSA', 'RILY', 'ROK', 'RTL', 'SBUX', 'STT', 'TROW'] 39 It has a Chicago Quantum Net Score (CQNS) of 74 'ticks' better than holding all 3,394 stocks equally. The SPY, or S&P 500 Equity Index ETF has a score of -0.000061, or 61 ticks better than holding all 3,394 stocks equally. Today, active investors looking to maximize their risk-adjusted expected returns should stay fully diversified into the S&P 500 ETF. .......... So, what are we doing? We are long two very risky stocks that we think are dramatically undervalued by the market. They are important companies to their customers, they earn significant revenues every day (brick and mortar firms with physical locations), and are working to make incremental improvements to their operations to increase earnings enough to reduce their debt leverage ratios and return to profitability (not just positive EBITDA). They are bankruptcy risk stocks that should do very well if the USA avoids a recession and the economy grows instead. These are also stocks that are actively looking to manage their outstanding debt and are working with their lenders accordingly. We are confident that these two investments will pay off, and we have a third company on our shopping list. |
Stock Market BLOGJeffrey CohenPresident and Investment Advisor Representative Archives
May 2024
|
 RSS Feed