|
Good morning. 11:06am ET. Markets are open. Not sure what I am witnessing. Interest rates are up, including mortgage rates. 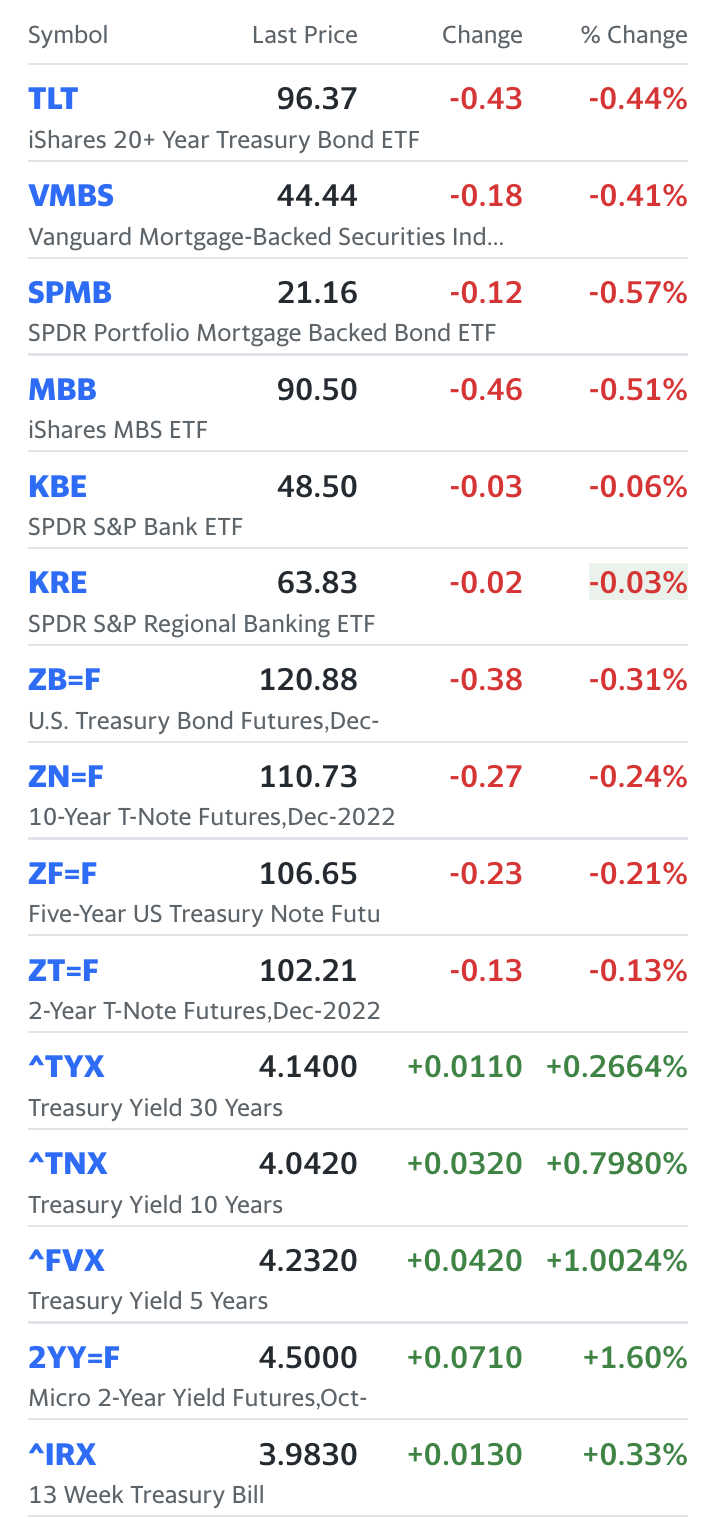 Will go through the list of industries we track (equities):
US Banks are decidedly mixed, with an almost equal number up as down. Quantum companies are mixed to lower Enterprise IT is a little lower, and most companies are lower. Logistics and Transport is higher Chips and Semiconductors are lower Cannabis and Tobacco are higher (the small caps) and the large caps which pay high dividends are lower. Dividends are 'out of fashion' today in tobacco companies. Crypto and miners. A few commodity miners and assorted stocks are up slightly, but the rest are down significantly. Dogecoin is up almost 5%. Coal is mixed. Retail is mixed. The largest, discount retailers are down. Money managers are down, except for a few investment banks and money managers. Robinhood is up today $hood. Oil, Gas and Pipelines are up today (mostly). Overall, the market is mixed and no single industry or narrative is holding. The FOMC meets on Tuesday and Wednesday, with a press release on day 2 indicating the new policy stance. Most banks are expecting a 75bps rise in the policy (or overnight and prime lending rates) this week.
0 Comments
Good morning and happy Halloween.
It looks like a different market today than Friday. 1. Interest rates are higher (13 weeks through 30 years: US Treasuries) 2. Russia ended the Grain Deal, and wheat prices (which means food prices) are up. In fact, food (grains) futures are up significantly, including oats, soybean, corn, rice, canola and especially wheat (up 5.5%). 3. The US Dollar is up slightly this morning, by about 0.5%. 4. Crude oil, precious and industrial metals, and US gasoline (wholesale) are lower today. 5. US equity futures are down into the open, suggesting a ~0.5% lower open today. This would claw back a little of the gains from last week, but not much. 6. The news globally is generally local. There were deadly accidents in South Korea and India. Russia is escalating their 'war on infrastructure' in Ukraine. Brazil had a successful, peaceful election of their Left party candidate Lula da Silva as President of Brazil. As a reminder, da Silva was arrested and imprisoned on allegations of corruption and served 580 days in jail. He is now back in power for a third term, and suggests that Brazil's 215 million people come together, unify, and move forward. At the open, our CQNS Short picks are either flat or down slightly. Our UP long picks are down (12 of 14 are down). After two minutes, all three of our CQNS short picks are up, suggesting a continuation of the push into 'stonks' we saw on Friday. The CQNS longs are still decidedly RED or down three minutes into the trading day. By Jeffrey Cohen, President & Investment Advisor Representative US Advanced Computing Infrastructure, Inc. Good morning. Notice a few things in the market this morning (pre-market at 8am ET): 1. The US Dollar has fallen significantly over the past week, and the EUR/USD went back over parity (currently 1.0081). However, this morning the US Dollar is stronger. Up by 0.35% 2. Copper is back to $3.50 / oz and other industrially sensitive commodities are also higher. Crude oil WTI at $88.12 / bbl is up there, along with silver at 19.35 / oz. This is not the sign of a global economy in trouble now. This demonstrates either market 'restraint' or 'strength' as companies acquire future supplies (which is possible pre-war with Russia), or that companies may be cutting costs, but not production in Q4 and into Q1 2023. 3. US Riskfree interest rates have risen, and bonds have fallen. Bonds are down this morning, and are generally very weak compared to where they were even just a few months ago. Interest rates across the yield curve are at or above 4%. This is great for savers, who can earn 4% interest with just a little effort. However, this is not great for companies or organizations (like regional banks) that hold bonds to boost current income through bond interest payments. They are holding bonds that have been weakening for the past few months. There was even a crisis in the United Kingdom about this when pension funds used borrowings, or leverage, to hold more bonds than they could afford as they fell in value. 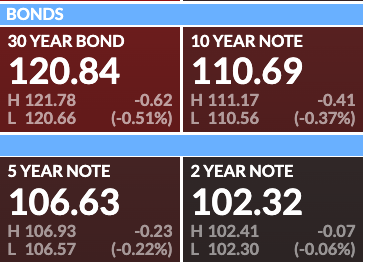 So, what does that mean for equities this morning? Europe is down a full percentage point, and Asia was down. The exception in Asia is the Hang Seng, which ended up almost 1%. The Hang Seng fell dramatically earlier this week, so a technical reversal or 'bounce' can be expected. It was up almost 4% at one point last night. US Equity futures are mixed. The Nasdaq Composite 100 ^IXIC is set to open lower by 0.6%. This is NOT surprising as tech stocks reported earnings yesterday and after hours and had issues. The Metaverse company $META, formerly known as Facebook $FB, traded significantly lower last night after hours (down 20% at one point as we watched) on top of a 6% drop during the trading day. Other stocks may be falling in sympathy, but it is hard to tell. The moves are too slight this morning. What are we watching today?
We have two personal holdings that hopefully will be profitable positions. There isn't much to do on those but to watch and either buy or sell. No need to discuss them. We ran our model last night, and will save that update for another BLOG post. Good luck to all. By: Jeffrey Cohen, Investment Advisor Representative US Advanced Computing Infrastructure, Inc. Chicago Quantum (SM) Maybe it does not matter that the markets look to head lower today. Our personal investments are well hedged (~75%), and our new Chicago Quantum Net Score / Smart Volatility 'hedged' fund is 100% hedged against downside risks. However, we keep seeing warning signs in the data. Here are a few that indicate that we are in a bear market and it is likely that equities will keep falling. Top 10 List: 10. Energy prices are up. WTI Oil is over $90 / barrel 9. Interest rates are up, and look to continue rising (long and short term rates) 8. Earnings season is coming and we see headwinds to profits, including the strong USD, rising inflation on inputs, rising interest rates on borrowings, and potentially slower consumer and B2B demand. 7. Variance of stock prices is elevated and continues to increase. Stocks are more risky by the week. 6. Stock prices keep falling 5. Market breadth is weak (many stocks falling and many new lows vs. stocks rising). 4. Corporate bonds are weaker (absolute prices are down and in many cases, yield spreads are increasing). 3. US Bank equity 'cushions' are declining for banks that hold long-duration bond investments 2. The Federal Reserve is likely to continue raising interest rates & tightening the US money supply 1. Potential for war in Europe between NATO and Russia over Ukraine. We learned a valuable lesson in August, September and October in this market. It is similar to a lesson learned in January, February and March of this year.
Always hedge a new long position. GLTA By Jeffrey Cohen, Investment Advisor Representative US Advanced Computing Infrastructure, Inc. Pre-market:
Dow, S&P 500 and NASDAQ futures all lower. Source: CNN Business. Bonds are looking weaker, down between 0.1% and 0.9% pre-market. MBS Trading lower this morning. Bitcoin down slightly, trading at its support level of $20k. Energy stocks are lower UST Interest Rates are higher, so US Treasury bond prices are lower. US Banks are set to open lower Money Managers lower Retail (wide portfolio range) lower Coal, Mining, Steel, & Crypto (all lower) Cannabis and Tobacco (lower, but mixed - some higher) Chips and Semiconductors (all lower or unchanged) Trucking and Transport / Logistics (all lower or unchanged) Computers, Phones, IT Services, Software & Hardware (lower) As we look at yesterday, we see that stocks and corporate/agency bonds rose. European equities are trading lower, along with Mainland China. Japan, Hong Kong and many smaller markets traded higher yesterday / last night. Energy trading higher. Overall commodities (excluding energy) are down slightly. We do have news about mortgage rates rising, and strong job growth in September 2022. Today is a day when we test our hedging strategy. Our longs are down...can we profit by our shorts being down more? Let's find out. Good luck to everyone in the markets today. Be safe out there. Finally, keep your eyes on the US Treasury Bonds. We believe these are key today. By Jeffrey Cohen, Investment Advisor Representative US Advanced Computing Infrastructure, Inc. So Jeffrey, I hear, what is the bottom line in the markets today? Bottom line is the stock market and overall financial markets are moving a little more than normal. That movement can accentuate trends. Highs go higher. Lows go lower. Things move more quickly and more deeply than before. Also, prices trending towards weakness, with lower stock prices, lower bond prices, and even lower housing prices. We see commodities weaker (except for oil, which is staying strong in the $80s). So, what should we do? We are debating that same question, and today, Monday, requires some deep analysis. When financial assets fall, expected returns rise, especially for companies that make an economic profit. An economic profit is when a company earns enough money to supply sufficient capital to grow, and to pay dividends (or pay down debt, or buy back shares). As those stock prices and bond prices fall, the expected return of those financial assets rise. The question is whether expected returns are rising as asset prices fall, right now, today, and for the next 253 trading days (1 year). Our models assume an 8.5% return on new money in risk assets (including dividends). It also assumes a 3.5% return to risk-free assets (e.g., 3-month US Treasuries, short-term CDs, Money Markets, US Savings Bonds, etc. Should we go up to 10% expected returns as the market falls further? When do we make that shift? When do most people become optimistic? Is it when stocks are falling the fastest, when stocks bottom, or when they begin a recovery? Do you buy the recovery or buy on the way down? When does the mindset change for the market in regards to expected returns? What our new Chicago Quantum Net Score / Smart Volatility fund is doing is to keep a relatively small number of stocks (currently ~12 longs) and three shorts. The model sees opportunity in risk today, and is RISK ON. If we increase our expected returns then the model will pick fewer longs, and will choose different stocks to hedge with. BTW, we are paper trading our model while we work through the investment processes, outsource our custodial services to Charles Schwab, and look at different hedging strategies. We will be our own first customer once the processes are complete and plan to open the fund to investors. What we notice in the markets is a falling knife. US Equities are down and trending lower. We are in a bear market. (TY Finviz) 32 new highs vs. 1,282 new lows (40:1) US Corporate Fixed Income is down too. We are in a bear market for bonds. (TY Finra Morningstar) 22 new highs vs. 1,633 new lows (74:1) Strategy #1: Do not catch a falling knife. Fear of missing out is a cost effective strategy. Wait for your favorite stocks that is reaching new lows to bottom before buying. Do not buy just because a stock is falling. Strategy #2: Fundamental valuations are more important than ever. As companies face higher interest expenses, and more difficulty in raising money (tougher terms & conditions), companies that are generating cash flow and paying down debt at a discount are building wealth. Look at stocks that are down that are worth more than their stock price and hold those dearly. As an example, we hold two stocks that we value more highly than their stock price, and will keep adding to those positions over time. We may be early, and we may be wrong, but we will feel ok holding those stocks for a long time while the market valuation catches up to fundamental valuation. Strategy #3: Stay hedged. Have a mix of investments that move up and down. We made the mistake in January 2022 of only holding bullish bets and it cost us dearly. Now, we are about 65% bullish, 35% bearish, and we are thankful for the gains of our hedges. We can always sell off our profitable hedges and replace them with new hedges at lower prices. See evidence below of the performance of the S&P 500 (TY Finviz) over 1 week, 1 quarter and 1 year. 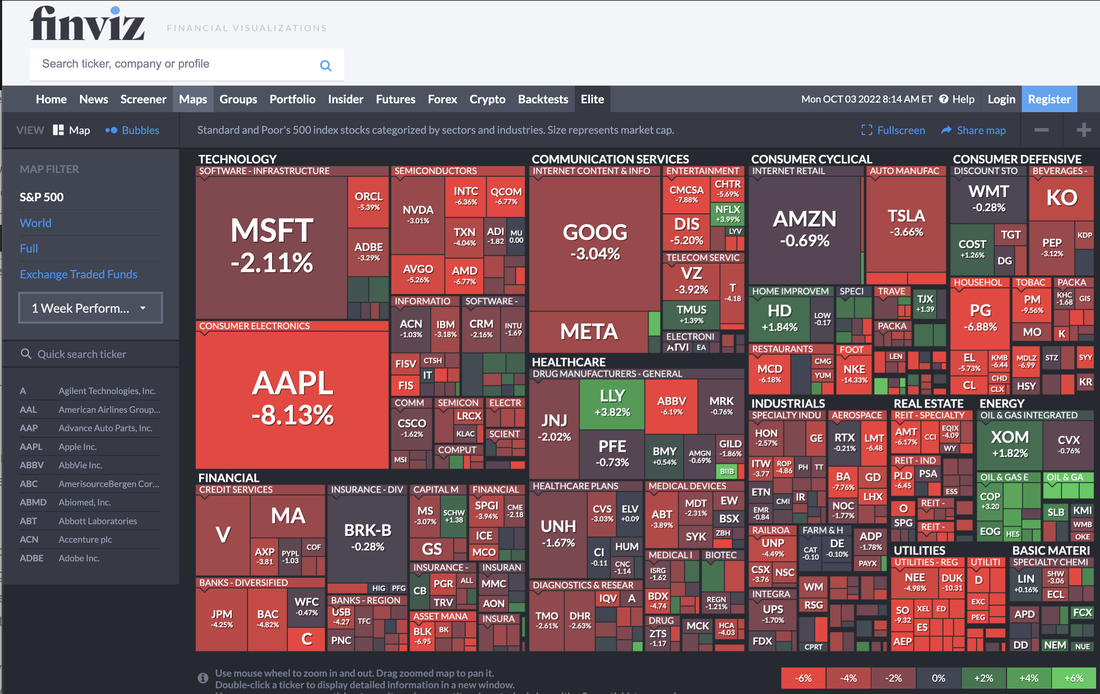 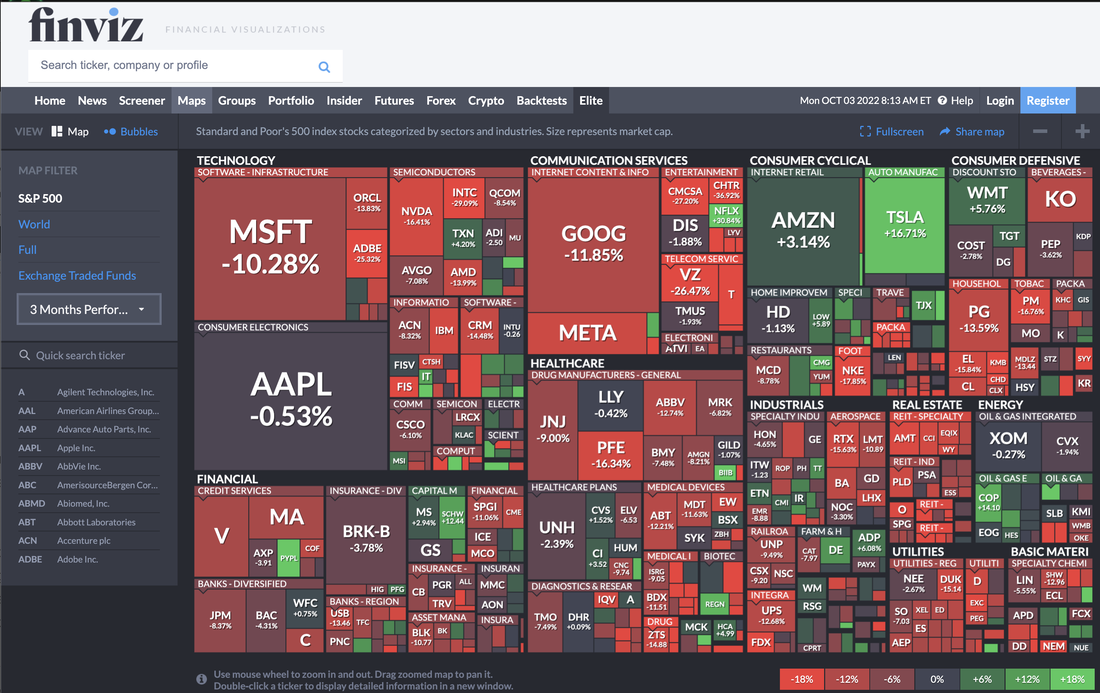 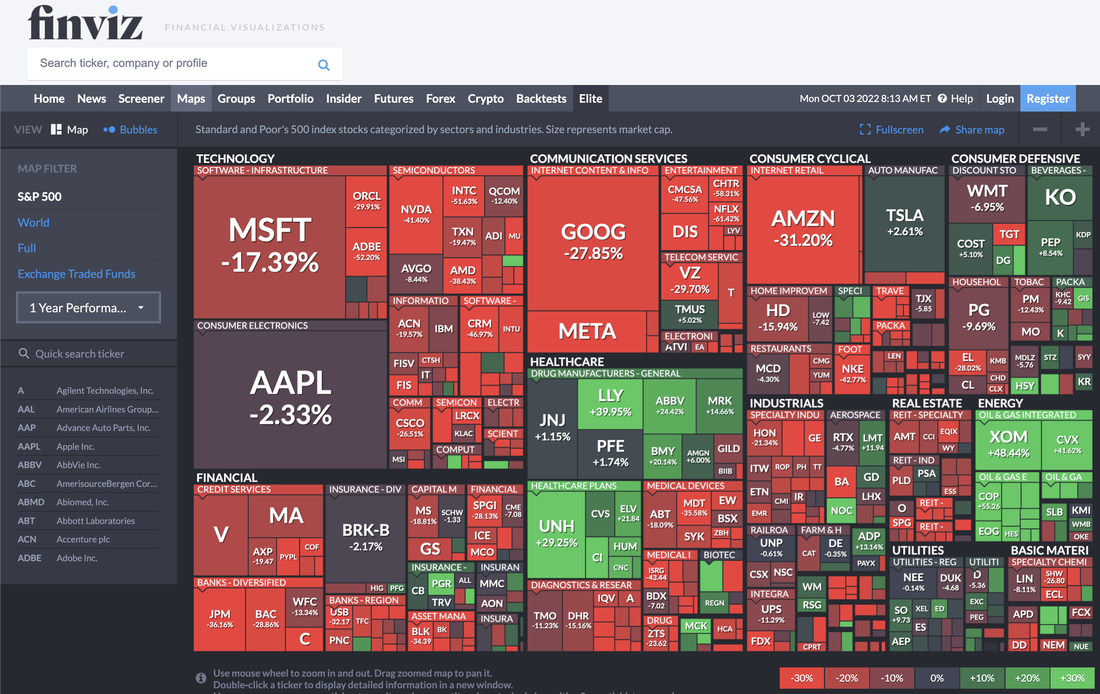 By Jeffrey Cohen, Investment Advisor Representative
US Advanced Computing Infrastructure, Inc. We have been managing our new Chicago Quantum Net Score / Smart Volatility fund through this bear market. It has been successful, and generally speaking our hedges are 'carrying the day' and providing earnings to cover losses on our long stock portfolio. However, today is a green day and two of our three hedges are up pre-market, and a new CQNS Down run stock is to replace one of our hedges. That stock is also up. This is when our fund will 'earn it's paycheck' and the longs should increase faster than the hedges decrease. Time will tell, and we will report back mid-day on progress. Our model suggested a smaller and more risky portfolio for today. This is a very similar portfolio to the one chosen yesterday, and reflects a 'risk-on' attitude with high-beta stocks. What is interesting is that we are net sellers in our long positions by about 2:1. We are buying one new full position, selling two full positions, and doing small DCA on three positions. We are buying back shorts on our $SPY hedges, and we are swapping one of our short CQNS DOWN Run stocks with another. Overall, we are reducing our hedge on CQNS short stocks by buying them back and taking smaller short positions. So, the market is showing strength pre-market, and we end up supporting that position with our trades by buying more than we sell, and buying in the riskiest positions.
By: Jeffrey Cohen, Investment Advisor Representative
US Advanced Computing Infrastructure, Inc. Updated to add commentary on US Treasury Bonds.
Sitting here on a Saturday morning trying to make sense of the S&P 500 Index performance from a technical analysis perspective. I have my Harry Potter wand nearby (from last year's Halloween Trick - or - Treating in Highland Park). We need to go back to that house. It was hosted by what looked like a real witch and a huge wicker display of mystical things. Very friendly too. She shared a wand with me although that was not something I was supposed to ask for.
So, what do I see when I look at ^GSPC (the index), $SPY (the ETF) and $TNA (the 3x long ETF derivative). The TNA has been higher, and is now lower. It is below its moving averages (20, 50, 200) using closing prices, exponential smoothing.If you look at the MACD lines below, it has been in distribution mode since about August 20 when the purple line crossed under the yellow line (momentum indicator turned negative). I call this the "riding the bicycle down the hill" pattern. It slows down and speeds up, but it keeps going as long as momentum is on it's side, which it is. Notice the purple line separating from the yellow line this week. More negative momentum. That is likely due to the FED FRB raising interest rates and giving a 'I am a flaming, angry, fighting Jackson Hole' speech with Q&A that reinforced the message that interest rates are going up to 5% if necessary. Some realized that could break some things (us too, we have shorts on one of those things), so the market turned lower. The TNA has three days in a row of selling with higher volume. True movement of 'stock' inventory out of investor's hands and into other investor's hands. Makes you wonder who is buying? The chart below shows ~ 6 months, and concentrated bouts of increasing selling last up to 5 days, then the market exhausts. Sometimes the selling only takes 2 or 3 days. This week, we had 4 days of increasingly heavy selling. Four days of downward pressure. If we sell into next week, it means we have tapped into a new source of pessimism, a new data point, a new paradigm. The TNA has an RSI (or relative strength indicator) of 29. This is a good way to look at longer-term momentum over the past 14 periods. We see that indicator is approaching its lowest point in 6 months, and in previous periods led a modest, intra-bear market rally. It is hard for markets to sustain either buying or selling for too long before they have to pause. We are reaching the commonly accepted limit of 20 (or 80) which probably correlates to standard deviations. Not sure.This indicator shows price movement and momentum. One last thing on the TNA. Notice the Volume Rate of Change indicator (Vol ROC (14)) over the past 14 days that shows the relative volume. This indicator shows volume trends. The last big spike in volume was in early September and showed the sell-off 'blew out' and exhausted itself. Previously in early May, we see buying volume pick up after ~2 weeks of selling, and that persisted for three days, with another spile later in early May which happened just before the May/June bear market rally. In summary, the TNA is going up and down, and the momentum indicators show (in hindsight) the changes. As we look at current indicators, two of the three point to continued declines (volume neutral, accumulation / distribution is negative, and RSI is approaching a reversal signal). The length of time of the decline, like RSI, is approaching a reversal limit. 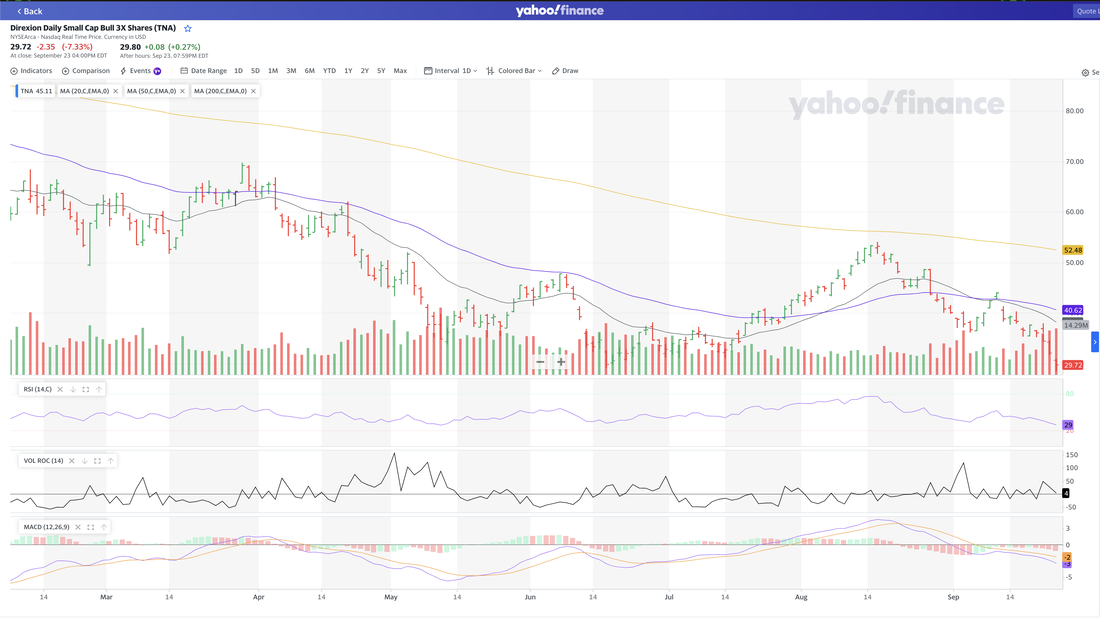
Let's look at the next chart which is the exchange traded fund (ETF) that tracks the S&P 500 Index. This trades like a stock, and although not a perfect correlation does not require the ability to trade futures to invest with. This chart goes back ~10 months and shows 5 separate declines. Those are marked by up/down lines. The horizontal line at ~430 is a general support/resistance line.
The first thing I notice is that the slope of the lines is increasing during this bear market. Makes me think traders and markets are growing impatient, or their bearish bets are growing bolder relative to liquidity, and this moves things along faster. The RSI (or price momentum) is reaching the limit / reversal level of 20. The volume in mid-September spiked at the end of the 'false flag' pattern of 4-days of rising, and began this recent bout of selling (volume spike before 9 days of selling). Accumulation / distribution indicator is showing continued and increasing distribution in this market. This cross-over occurred in mid-August and we have seen a month of downward movement. The question for us remains whether the market wants to continue the downward movement. There is no reason for the market to change direction. No change in fundamentals. Nothing political that we can see. Just a weekend for traders, investors, corporations, pension funds, and money managers to look at these same charts and ask themselves a question: " Do we aim for 350, or an S&P 500 level of 3500?" Are we sufficiently positioned for bearish movements, or did we blow out our shorts and puts? The rising volume on Friday (we can dig deeper into the Friday chart) could indicate traders bought back their positions on Friday. 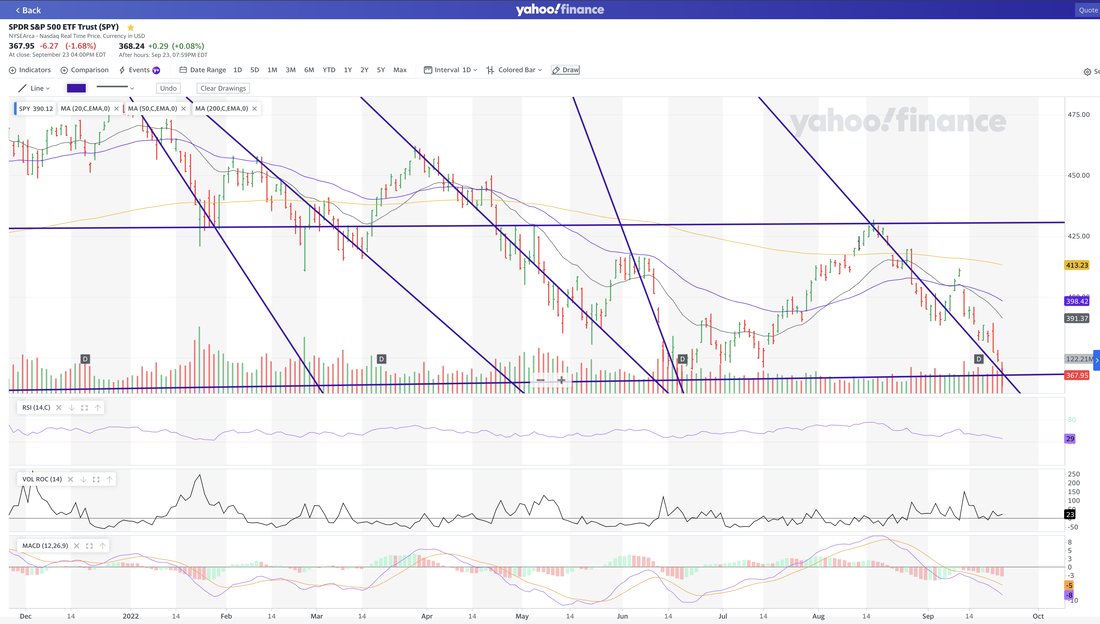
The next chart is the 5-minute chart for the $SPY ETF. The indicators are all showing performance relative to 5-minute periods.
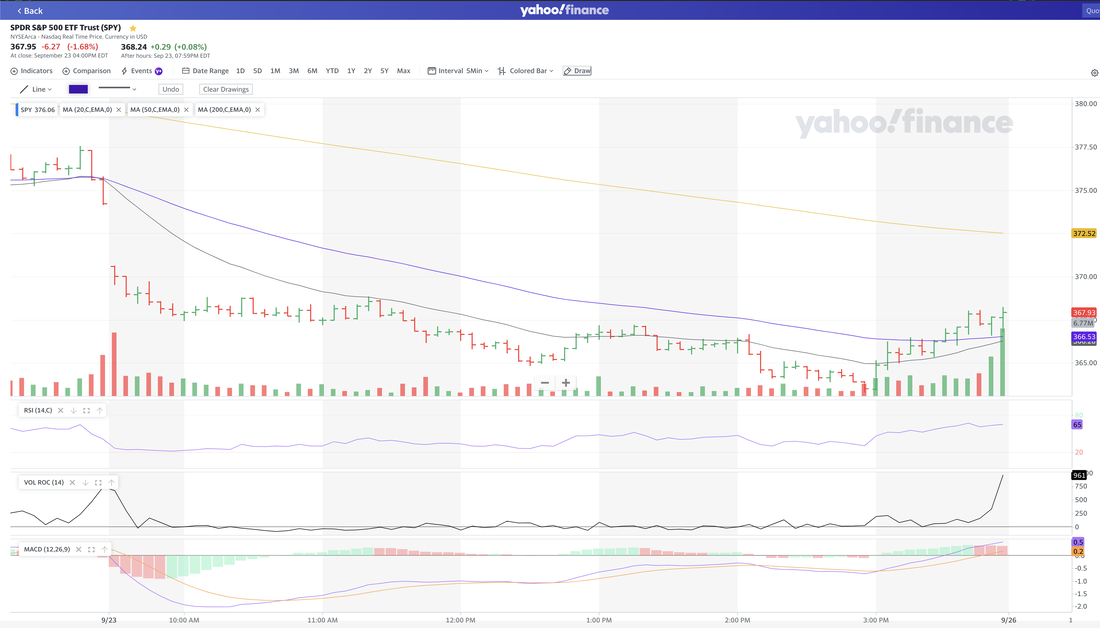
We can see that 'all' the price movement of the day happened in the first 10 minutes of trading. The rest of the days was calm, and the last hour was very bullish. The market bought back their short positions at an even higher volume than they sold them at the beginning of the day. This is a familiar pattern for us in other market sell-offs years ago, and worth a quick mention.
Anecdote time. We are building our managed account / hedged fund to offer to investors. We are paper-trading it now, but very realistically, entering trades with a brokerage and tracking things to the penny the way we would do it if live. We are a front-loaded fund that trades at the open based on pre-market values. We noticed that the market was down considerably in pre-market. The bets were in, the stocks had fallen, and we ended up dollar cost averaging (DCA) up more than a few positions and adding a few new longs from our model. When we calculated our NAV / cash balances at the end of the day, little had changed. Less than any day this week. That is when we noticed that the huge decline all happened in the first 10 minutes of the day. We noticed that $CS, or Credit Suisse First Boston was down significantly today. What if this was a 'big hairy risk bet' by a trading house (not $CS) that has to make up for a poor Q3? There are few days left, and liquidity is awfully tight. News is bearish, interest rates have been hiked, and financial twitter #Fintwit is filled with market mavens or fake gurus, #FURUs, willing to repeat and retweet a story. So, they spend the premium to buy up puts, they short mostly liquid stocks, likely make some bets in the futures, and see if their pessimism can be amplified throughout the day. They buy back during the last hour, and count up the profits. If they sell first and buy back first, they do the best by capturing the change during the day. For other 'fast followers' that copy the trade, their shorts after 09:45 and their covers after 15:15 did not do as well, and the later the bets were made the worse they did. This tells me that Friday may have been an isolated event by a few big desks to force a sell-off on a Friday. It didn't work, and now Monday comes and more traders lost money and likely hope in their magical, Harry Potter gambling powers, which would limit liquidity further into Monday. In closing, markets go up and down. Watch for big desks making big bets as you will see them in pre-market. A pre-market or market open sell-off is not always bearish, especially if there is no fundamental catalyst for the trade. Look for the cover by the end of the day (last hour?) and maybe beat them to the punch by a few minutes. Good luck to all. If you want to buy a run (a market analysis) so you can emulate our managed accounts / hedged fund, you can go to our Quant Analysis tab and purchase there. We run the models, write reports, provide data, and we think this would make you a smarter trader / investor for the next 20 trading days after accessing the data. Visit https://www.chicagoquantum.com for our brochure.
UPDATE: One last thought about an hour later...
What happened in the 'real economy' to support this recent decline in stock prices? Interest rates rose for long-duration debt (think 10-year and 30-year US Treasuries). Those are not caused by the Federal Reserve. Prices for long bonds are driven by the market. They bring together a few ideas to set a price. 1. Supply and demand of bonds liquidity: There are plenty of bonds to go around and fewer people want to buy them (at least since August 2022). In a situation of high inflation and positive expected future economic growth, this money will be needed (our SWAG). 2. Inflation really is here to stay. 3. The economy isn't that bad. 4. The Federal Reserve Bank NY Branch and FOMC refuse to begin quantitative tightening with anything like urgency. Last I looked, on ~8.9T of debt, we removed ~0.15T from the FRB balance sheet. 5. US is raising short-term and policy interest rates. This tightens capital for stock speculation. 6. The US Dollar continues to strengthen, and the world's economy keeps going (at the expense of standards of living outside the US). This hurts US corporate earnings (as they are earned overseas and repatriated / revalued into US Dollars). I would watch the long bonds for a clue on future stock prices. The higher long bond rates go, the lower stock prices tend to go (all things being equal, and not an R = 100%). I follow many stocks, and two of them are worth mentioning. 1. Big company with lots of debt. Buying back debt at a 20%+ discount. People bidding down the stock price just in case they stop generating cash, stop earning healthy revenues, stop making a profit, and that debt load crushes them. 2. Small company with lots of debt. Sold off two parts of their business to pay down revolver (low interest rate, but most senior and restrictive debt). Being crushed under senior unsecured debt yields, as interest expense now exceeds earnings. Their debt yields 15%, which will likely be the cost of new debt if they need it (which they likely will). Crushed under existing debt costs and unable to borrow new capital at less than PE or Pawn Shop rates. Stock just crashed. We are optimistic on the first stock as we feel / believe the economy will keep them afloat and ahead of their heavy ($150B) debt load. They can always raise a few prices, cut a few costs, and maybe advertise a little less. They have market power. We are less optimistic on the second stock. We are not sure they will make it through the next debt cycle in 2026 without massive dilution, being acquired, or a little Harry Potter magic. 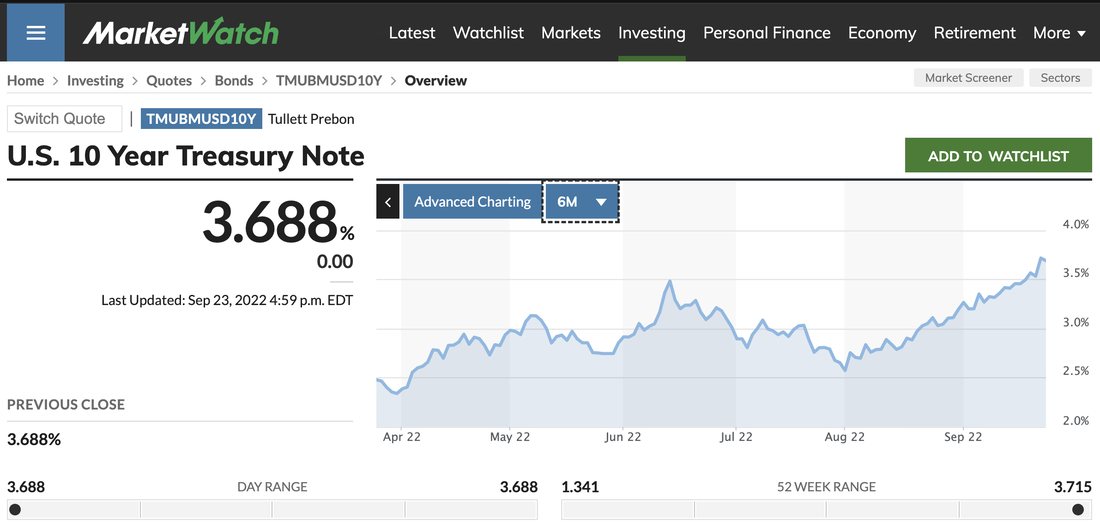
Had a thought and chased it down. There was a morning bet against the US Treasury 10-year bond. It is not an out of the ordinary bet, and the same bet did NOT happen in the 10-year UST. It just pushed yields up to almost 3.75%, or about 2.5 basis points (bps). It took 5 minutes, and in the next five minutes the bet was reacted to, and rates were pushed down almost 3 bps. The move of 5.5bps is very large, especially in 10 minutes on a Friday when there is less market liquidity, and nervousness about.
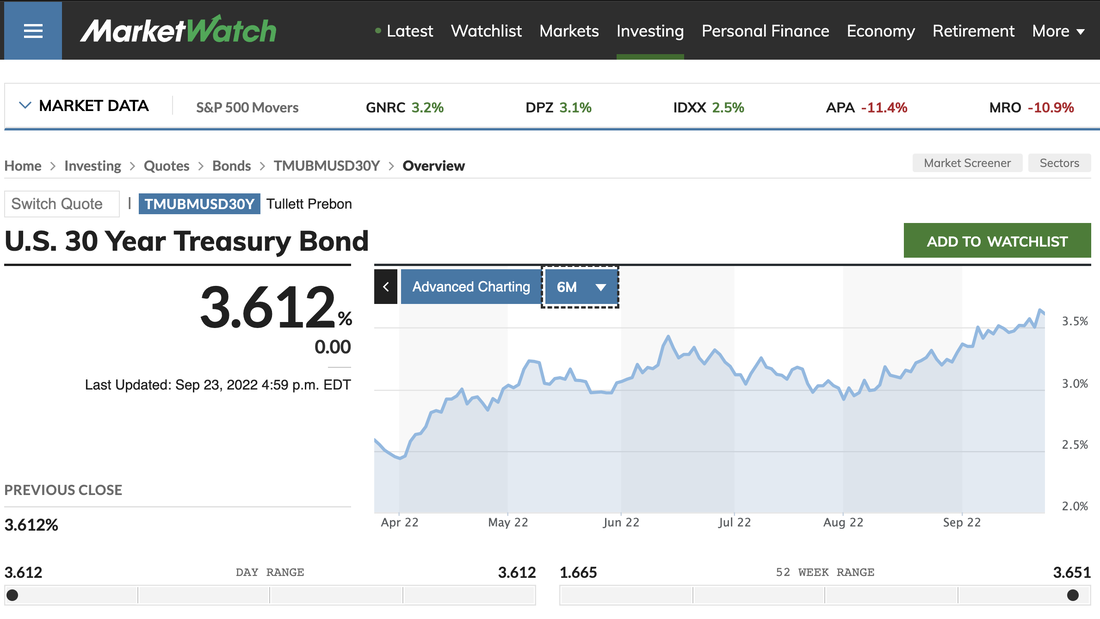
By mid-day, the yield on the 10-year was up the 2.5bps and more, for an intra-day move of about 6bps. What's more, the yield on the 30-year US Treasury bond also rose into mid-day, although it did not meaningfully participate in the morning market open action. So, one possible thread on Friday's action: - Morning game of racquetball or breakfast at that fancy hotel in Midtown Manhattan to discuss how trading profits are down. Bonus checks will be flat. We could even get, gasp, fired. What to do? Let's bet other people's money and have a really, really big day today. Let's make it all back in one screaming jubilee today. - One partner, Luke (or was it Obi Wan), says that we should bet the markets will go up, and tell all our friends and clients to buy some stocks and bonds. This way, everyone in America gets richer, and flowers bloom. - One partner, Darth (or was it Senator Palpatine) says that stocks take the stairs up and the elevator down. No time for stairs, let's do a Die Hard and force a big escalator move lower. You know, Black Monday only took one day! So, it was decided that the equity desk would sell everything it could get its hands on pre-market (never mind the larger spreads) and put in place the pre-market down equity bets. Once that was done, it started at the open by selling everything it could that was not nailed down. It was a storm of fury for 10 minutes. By then, the ammunition was spent, there was nothing else to sell, and the markets did not actually fall further. I even read a 'well placed' tweet by a #fintwit account that maybe the selling was due to an investment banking failure, and $CS stock was down hard. It didn't work. The next partner entered the fray 15 minutes into the market (5 minutes after the first partner was done), and they used a laser beam and toasted the 10-year US Treasury Bond. They sold it hard, for 5 minutes. They probably borrowed a bunch of bonds, sold their own inventory, and maybe even did something with futures or options (but we don't know that). They drove up yields by 2.5bps. This is a big market, and after 5 minutes they were done firing their cannons. However, the rest of the market woke up and bet against the crazy bond desk, probably thinking it was a fat-fingers mistake and easy money. The yields on 10-year US Treasuries actually fell by more than it went up (not just unwinding the 2.5bps, but taking yields down another 3bps). So, that didn't work. Actually, later on in the day the yields on 10-year and 30-year US Treasuries did rise, then fall. It seems maybe that trading desk shook things up just enough, but by the end of the day the action was flat. Ok, the bets were made and nothing worked. Stocks and Bonds did not follow. Nothing happened! Now, it is approaching market close. It is an hour before the close, and the markets have had a meh day, with ups and downs, but no trajectory. The equity desk starts closing out and covering its negative equity bets. Since they knew it was their bets that drove the market down, they wanted to cover first after eliminating any doubt that their 'trick' would not work. They waited until 1500 ET and started to buy back negative bets. It was done by market close. On fixed income, my guess is that they closed out their negative bets for a loss either before lunch, or by around 1400 ET. It is too hard and too embarrassing to lose that much money on US Treasuries. Also, that could actually cause the head of the desk to get fired. They likely missed the tiny recovery into market close (which likely was tiny because they already covered). If you like this scenario, you are likely to see it more and more between now and next Friday, Sept 30, 2022 when Q3 closes. If the market stays in a bear market pattern, you may also see this in Q4. 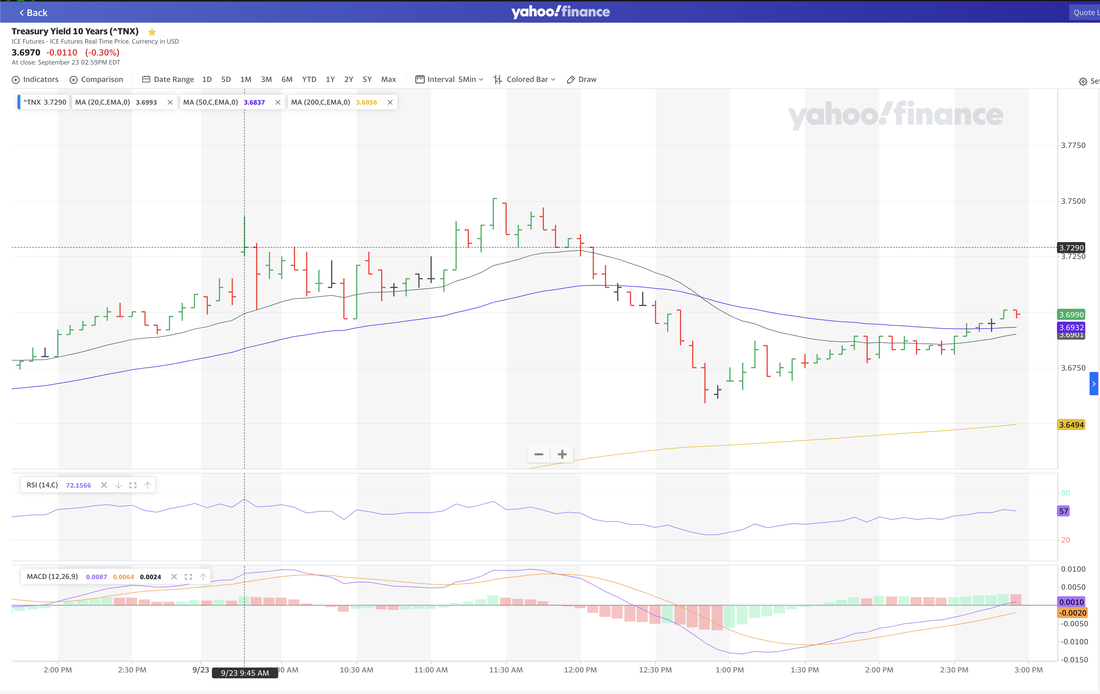
Markets look to open lower today. Market breadth is significantly negative as of Friday. Interest rates continue to move higher, with the Federal Reserve Bank, Federal Open Market Committee (FRB FOMC) press release and new policy statement will come out Thursday afternoon. The market will be tentative and hesitant until that interest rate announcement is completed. We see the US equity market continue to fall, and significant negative market breadth on Friday. New lows in fixed income (corporate) were about 90:1 vs. new highs for bonds. Stocks were closer to 9:1 new lows to new highs. We walk through Mortgage Backed Securities this morning (they are down), and how they work. We also walk through Verizon's schedule of debt and that we think we see Verizon buying back their own debt at a discount. This will increase their equity and earnings, and reduce future interest payments. A few hours into the trading day and the market is negative today. Sleep well traders in North America. It looks like good news in Ukraine and the strong potential for a very small CPI reading on Tuesday (due to energy price weakness) will influence valuations into this week. The equity market rally (bear-market rally) looks to continue for another day.
We have our model set to a ever-so-slightly more optimistic position of 7.25% expected return and 3% riskfree rate. It caused us to cover some of our shorts (our hedge of the $SPY) on Friday morning and buy higher-BETA stocks. We stand by our slightly more optimistic settings for today's market. The Futures and Asian Markets look to validate this decision. Let's see where the week goes. Good luck to all. Well, the US equity markets are up slightly and stronger today. This is welcome news for us personally, as our personal holdings are down > 50%. The supporting financial assets are as follows:
Some of these movements could be due to the global energy shock as the world realizes that clean energy may not be plentiful enough, and that Coal, Oil and Sweat may be required for the foreseeable future. Sacrifices in demand must be made if we are to live with less energy, or we need innovation to leverage higher energy alternatives (like nuclear fusion, fission, and space-based. In fact, I am getting up now and turning off our AC (true). We are reflecting today on the sector rotation underway in the US equities market for the past year. Energy stocks have risen while consumer / communication stocks have fallen. It may be time for that rotation to reverse itself. Take a look at relative performance at Finviz here. Our model suggested a move into more commonly held stocks, and more of them. It takes 25 stocks, evenly held, and hedged against the SPY, to create an edge (or alpha) that can be captured regardless of market movements higher or lower. This is because variances are up, risk-free rates of return are up, and market expectations of new risk capital returns are lower. 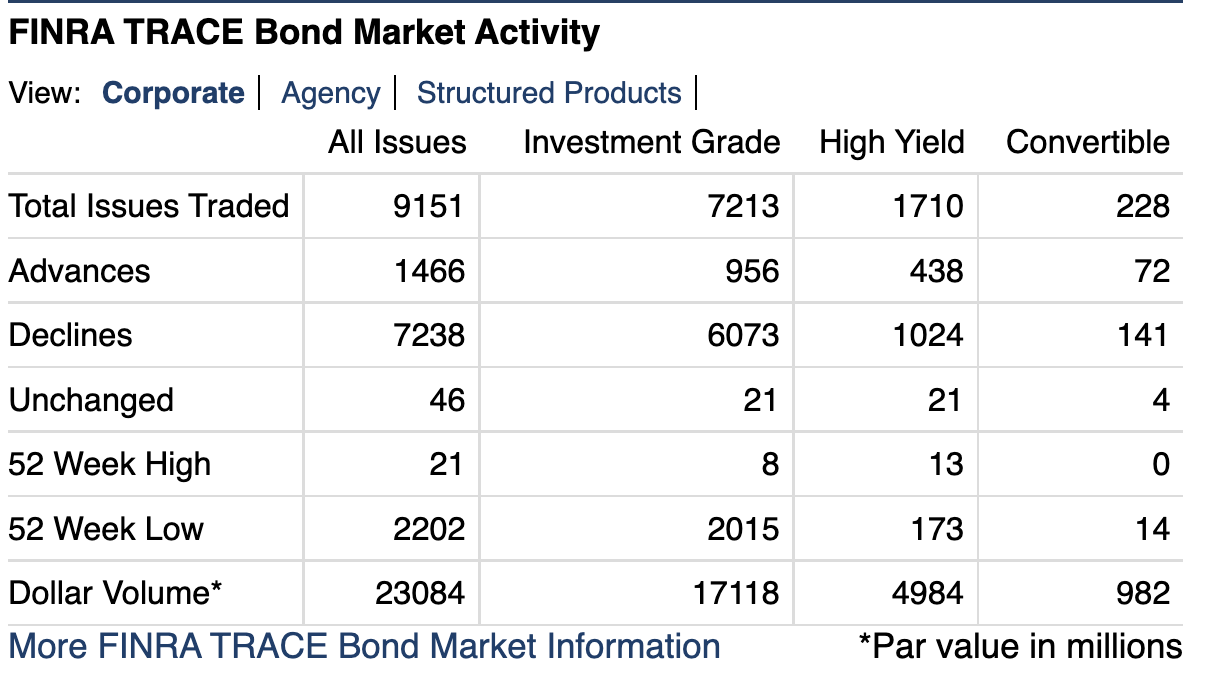 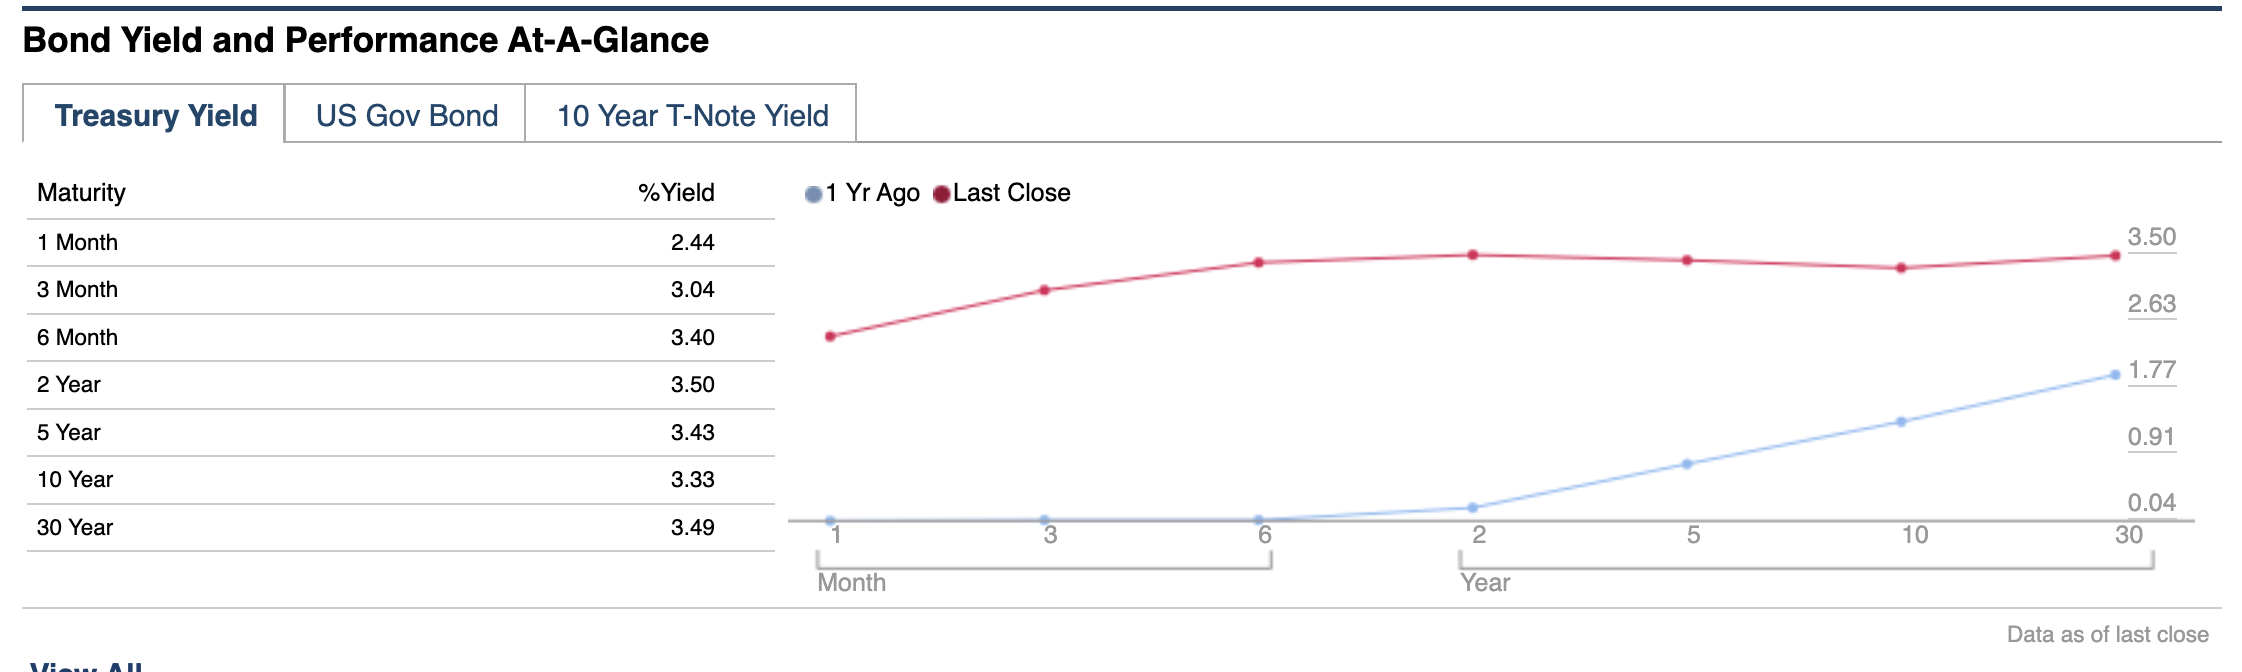 In terms of sectors, retail looks strong. Coal is weak. Retail Banks are doing ok (mixed but higher), and the rest of the industry sectors are mixed. Not to say 50%/50% up and down, but almost every sector is mixed.
A few learnings as we papertrade our model in a repeatable, scalable fund concept.
1. We did not buy and sell at the open, or in pre-market. We waited 17 or 19 minutes into the trading day. Paper trading only. We made a few dollars because stocks fell early, but we also lost on stocks we were exiting. We hold the same 5 core stocks and the SPY hedges for a 2nd day (no transaction costs or trading), but we were supposed to buy 2 stocks and sell 2 stocks. By the time we pulled the trigger, the market moved. In today's market, that movement was material to our results for the day. Objective: how to rebalance effectively, and how to avoid the 'market open' in rebalancing on a down day. 2. Our core 5-stock holdings are down significantly today. They are down from 4x to 12x the percentage drop of the SPY. When the market is rising, these stocks rise faster than the SPY. However, when the market falls they fall faster. With a time horizon of minutes (watching the tape), this seems catastrophic. With a time horizon of days or weeks, this evens out and is what we expect to see. The BEAR market leg lower is not kind to high-BETA stocks, even those that work well together. 3. We set our model to assume positive expected returns to risk assets. If we were to reduce our expectation for profits in the stock market, or increase our expectation of the risk free rate of return, it changes the stocks that we pick. It is hard to know how to calibrate the expectations of investors. This is an area to focus on. For example, if we assume that September is a bad month, and investors have lowered expectations of earnings for 'fresh' money in the markets, then the model would pick less risky stocks. This allows the 'edge' to work better and more slowly than for high velocity stocks. Think Berkshire Hathaway B-class shares vs. Bitcoin financier. We will work through these issues and have a fund concept that is workable. It requires a consistent management process, labor available in the evenings and mornings every day the market is open, and commitment to learn and evolve the process. Thanks for taking the journey with us. If you are interested in learning more, please reach out via our 'contact' page. Regards, Jeffrey Cohen, President, US Advanced Computing Infrastructure, Inc. By: Jeffrey Cohen, Investment Advisor Representative US Advanced Computing Infrastructure, Inc. September 1, 2022 Market will be down today. Will it? Will the ‘smart money’ decide to reverse course…or let us fall into a bear leg lower? - Social media was silent on the markets - Politicians are silent on the markets IMO (not advice): Inflation is going to read lower. QT has not yet kicked in. Liquidity pressures are ‘in perception mode only.’ Equity and commodity and interest rate futures are all lower this morning. From foods to metals, to stocks and bonds. Energy is down too. Good news for inflation. The US dollar is up (bearish) The VIX is up (bearish) Equity markets globally are down, for example: The Nikkei (Japan) and China markets (including HK) were down Europe was down The US was down yesterday Bitcoin has returned to the support level of $20,000 and is trading now at $20,004 Equity Market Breadth Negative 1: 2 A/D 24:384 NH/NL FOMO is a cost effective strategy (stocks that are down may continue to fall for a while) Fixed Income Breadth Negative 2.6:6.7 A/D 40:777 NH/NL Largely centered in Investment Grade. Slightly better performance in the high yield markets. Weakening of credit quality in the top US corporates. Per the Morningstar indices, and market sectors, all areas of the market are down, led by cyclicals down -0.86% yesterday. The yield curve continues to be largely flat, and is rising (higher yields) with a 2-year peak yield of 3.45% and a 30-year yield of 3.27%. This morning bonds are down (across maturities) significantly. My two stocks (in our portfolio) still look very weak. Technical analysis suggests massive quantities of selling. Percentages of the common stock outstanding sold in the last 1-2 weeks. Big selling. Pre-market sectors: Regional banks, evenly but sparsely up and down Money Managers DOWN Retail Mostly Down Physical miners & metals, bitcoin (DOWN) Cannabis and Tobacco (mixed) Chips and Semiconductors (all DOWN) Trucking, Transport and Logistics: DOWN Enterprise & Personal Computing & Networks (B2B): DOWN Quantum Computing Mostly Down BX: A high-yielding stock we like in a money manager looks like a ‘great deal’ but in a declining market all stocks could and may go lower. What do you do when the markets flash RED for equities and fixed income and economically sensitive metals and commodities.
When the US dollar is stronger than ever. Balance of long and short Not buy any new stocks until the pain subsides (let the market run lower). FOMO is a low cost strategy in a bear market. Time to buy … tomorrow For money managers, institutional, and high net worth individuals: - There is significant movement in the markets. - Look for your edges and trade them. - There is enough movement to profit. By Jeffrey Cohen, Investment Advisor Representative US Advanced Computing Infrastructure Inc. Good morning to my cherished friends, clients, followers, family, and friends. This morning the markets look weakly higher. There was some news this morning to share, and we see markets that opened slightly, and weakly higher but are now flat. 1. The Case-Shiller US National Home Price Index is moderating. Housing prices were rising quickly, and that curve is now flattening. We think it is because of increasing interest rates on conforming 30-year fixed rate mortgages. Fewer home purchases likely means less spending in the economy. This is likely not the case for rental properties (in our opinion) which we think are driven by different factors. Rents are likely to move higher due to previous buying up of smaller, rented homes by large investment trusts while prices were lower. 2. The news in ZeroHedge and CNN were, well, about general interest topics. Lots of domestic news about violence, politics, medicine and just regular stuff. Not much discussion of markets or the economy In our words, the fix is in and our attention is being diverted away from money and markets. It could be rational behavior by those operators who show what is in demand. When we enter a bear market (again), people lose interest in stocks and investing. 3. Market breadth was very, very negative and bearish in both US corporate fixed income (bonds) and equities (stocks). New lows were significantly larger than new highs, and decliners outnumbered advancers. This is another sign of a bear market (yesterday's results). 4. Energy prices are down in the US. Gasoline was trading close to $2.50 per gallon wholesale, and is now at $2.61/gallon. This is a significant decline from a few weeks ago, and will help give us a reduced inflation reading (CPI). Oil is also trading lower, down to $90.50. 5. Currencies (non-US) are trading lower (meaning less valuable when compared to the US Dollar). We spent time in our morning video discussing the Japanese Yen at 138.50. We read that the Chinese Remnbi is also around 7.0, which is also very weak. These two export-focused economies are keeping inflation out and driving their export markets by lowering domestic income from export-related businesses. It also increases the price (and lowers demand) for imported products. 6. Copper grade #1, in contracts of 25,000 pounds, is trading lower at around $3.50 / pound. This is a sign of weakness for economic inputs. We also saw silver and gold trading lower. This will hurt the price of $FCX, which is a large copper producer. 7. Bitcoin is trading around $20,000 again. Dogecoin is around $0.063 8. Interest rates for savers in accounts of $100 or more have reached 2.20%. This higher saving rate helps lower the expected return for risk-based assets for the retail investor class.
9. The Federal Reserve Bank is not really tightening the money in circulation. They are not really doing quantitative tightening (QT) like they said they would. Sure, the amount of assets the FRB has liquidated is positive since April 2022, but it is $114B. That is miniscule and most likely not significant. We also discussed how the FRB is lowering the prices for MBS just as they might have to sell some. This is a market subsidy to market makers paid for by the taxpayer (which is you and me). 10. The Consumer Price Index (CPI) reading by the Bureau of Labor Statistics (BLS) will likely read lower and slower growth during the next reading. The largest component of growth is energy prices, and those are falling (at least for gasoline and oil, but not for coal). This recent fall in energy will support a 'friendly' inflation reading. Well, that's all folks. The US equity markets are trading down today. We will be focusing on building out a CQNS UP run model portfolio today. Stay tuned for more updates!
By Jeffrey P. Cohen
Investment Advisor Representative US Advanced Computing Infrastructure Inc. Chicago Quantum
Update: 1430 ET today: The market fell hard today, and indiscriminately.
The market looked stronger this morning pre-market. However, it quickly headed lower. The market fell after Federal Reserve Board (FRB) Chairman Powell gave a fire and brimstone speech. We listened to it live and in replay mode, and were assured that the FRB would maintain its fight against inflation (bringing it back to 2%) with a tenacious and relentless focus, regardless of the cost to our society. This caused the financial markets to teeter on the brink. The US Dollar rose, interest rates (the long ones) rose, global stocks fell (except mainland China), and it looked like the bear market was in full bloom. High risk (high BETA) stocks fell dramatically. However, today, the picture looks different. It seems like things are settling down. We are worried about the size and amplitude (dramatic) financial markets movements based on a speech that was most likely a distraction meant to send the markets lower. It cost us a significant drawdown. We were uncomfortable for the weekend and Monday, but survived to trade another day. Now, Copper and other precious metals are back in their range. The US Dollar has moderated and interest rates seem to have calmed down (but they are still elevated). We made a video, and hope you like it. It is early pre-market, 0700 ET this morning. If you like the video, please hit the subscribe button and drop a comment. It helps us spread the word, since we are not paid to make the videos, nor do we advertise them. When you subscribe / comment, it tells YouTube that this is trusted and safe content that they can recommend to others.
Good morning, what we see are stocks trying to rally with flat futures prices. However, we saw a strong US Dollar and rising interest rates (yields on US Treasuries). We see an elevated VIX which means the price of downward protection is elevated, up about 25% over the past week. Commodities are mixed, but the pressure from the US Dollar and interest rates will be bearish on US equities. GLTA Enjoy our video below. In it, we discuss Verizon Communications $VZ in great detail. We share what we saw when we decided to go long the calls on $VZ, and why the stock price dropped this week. By: Jeffrey P. Cohen, Investment Advisor Representative US Advanced Computing Infrastructure Inc. Chicago Quantum Yesterday was a tough day in the markets. We saw it trending significantly lower in pre-market, and by the time the markets opened at 0830 ET, the move was largely completed. Thank you Finviz.com for the visual below. It does not mean that the markets were silent during the day, as we saw our investments move significantly during the day, but the die was cast early. In full disclosure, we added a long and a short position on Friday, and sold our short position Monday afternoon for a 2% profit. It was good work. However, our long position lost more than the gain and we added to our long bet with 80% of the profits of the short trade. This is what most investors will do, add to their long bets and 'buy the dip.' We did, fingers crossed. No bling bling today until our ultimate trade settles (hopefully higher). The market flip-flopped this morning in the past hour. Interest rates moved negative. US equity futures moved negative. VIX: negative. Semiconductors and chips are more down than up this morning. The market moderated this morning, with 17 minutes left before market open. The trades that looked obvious last night are mixed this morning. We will be watching the screens today. 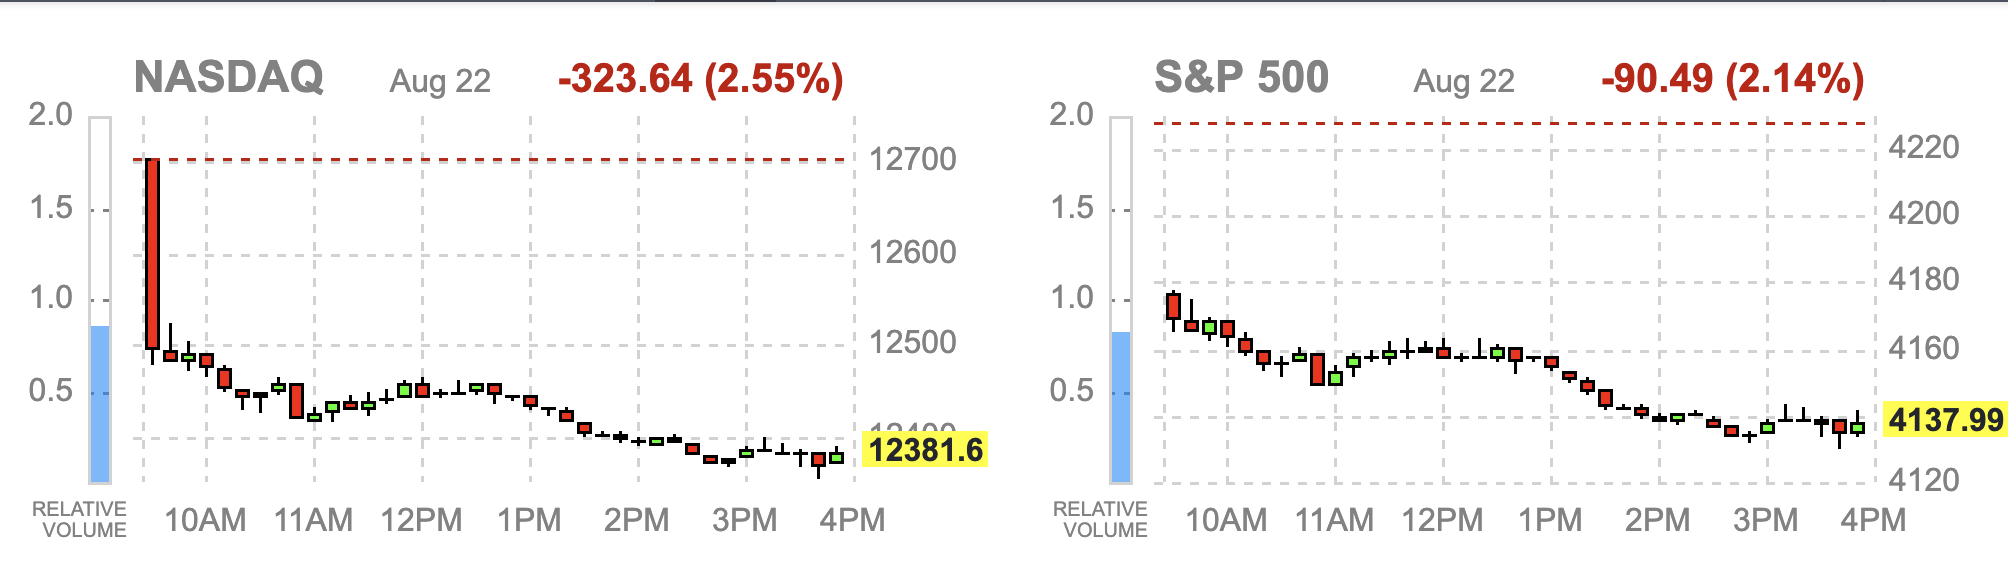 The markets are interesting and show some conflicting data this morning. Interest rates rose this morning in the past few minutes (all pre-market), and they were down earlier. Most economically sensitive sectors are trading higher pre-market. The US Dollar is on fire, up against most currencies. However, the market is on a new downturn leg, down 5% over the past five days. Watch out, this could be the beginning of a new movement lower. I do like that the pre-market action is pointing higher, which could be just normal trading or a Bear Trap. 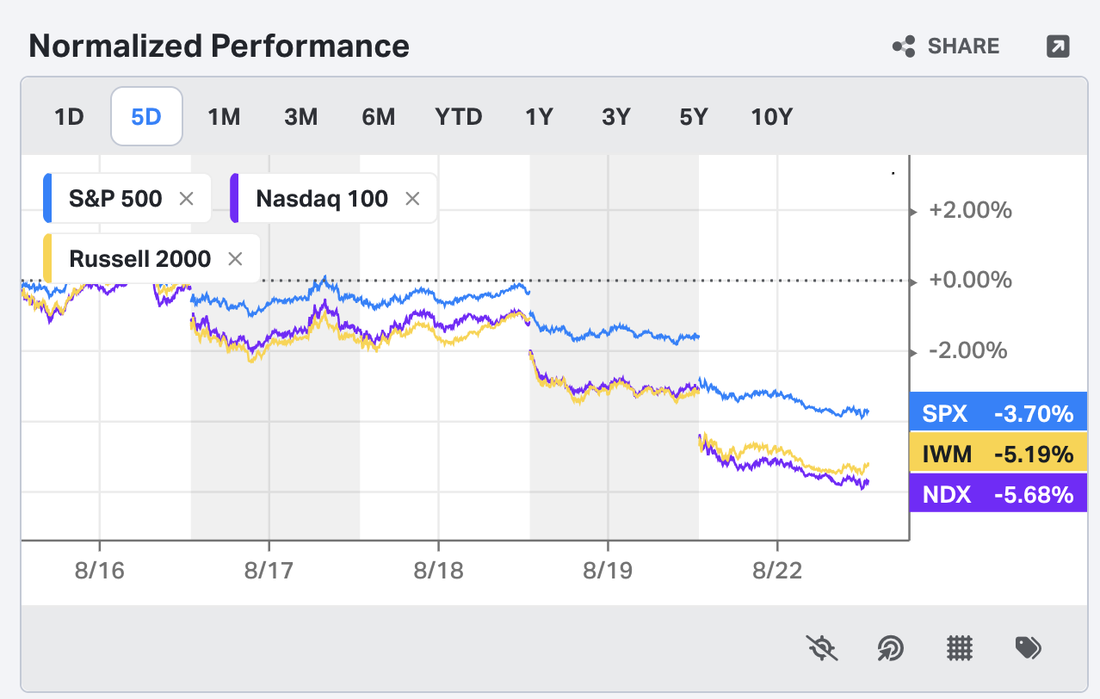 By: Jeffrey P. Cohen, Investment Advisor Representative US Advanced Computing Infrastructure, Inc. Ok, we see weakness across the US and Global (non-US) stock markets. Even Jakarta and Malaysia were down yesterday. However, mainland (PRC) China stocks were up. Europe is down. The cost of insurance is up significantly, as measured by the VIX. We get the feeling that traders are betting against US Equities using the Nasdaq Composite 100, The S&P 500 Index and the Russell 2000 Index. They are simultaneously buying puts, which will profit as the market drops (so, they make money both ways, actually 3 ways). Profit on the shorts, the puts and the insurance, and if they bought the VIX, they make money on that too. Who is losing today? The individual retail investor who bought risky stocks. You know who else may be losing today? Bank depositors. The top 10 US banks are trading lower in pre-market. Not sure why, need to take a look. Good luck in the markets today. Be careful, we have not seen a down Monday like this in a while, and it could define the week. Other notes we took while recording our video: 1. Yield curve not really inverted anymore, the long bonds are dropping. 2. Corporate bonds, especially investment grade, are dropping (both yield, and risk) 3. Economic metals are down, slightly. 4. Energy is flat this morning. 5. Long UST Notes/bonds are flat. 6. Yahoo Finance VIX is up 18.25% this morning to 23.13. FinViz VIX was already at 24.50 last night. 7. Fallon: Fibonacci Retracement Support level markets were down 23.8%. Fibonacci circle is found in nature as being a very efficient shape. Snail is a fibonacci. If you like Gold, NEM Newmont Mining. If you like Copper, FCX Freeport McMoran BX Blackstone $103.30 The Carlysle Group CG: $33.56 Narrative: Economy is doing great. Lots of Jobs. Inflation still a concern: FRB: Continue QT and Interest Rate Hikes Stock Market: US Equities: Will start to fall again Bond Market (Corporate): Will also fall US Treasuries (short-end will see higher yields) and (long-end: market will decide). Short UST: unchanged 1-year UST are up to 3.3% Mortgages are up 30-year fixed conforming: to 5.6%, and MBS are down sharply. Quantitative Tightening Pattern (up and down) - rinse and repeat. Each time, it goes lower. Silver under $20.00 an ounce. Gold at $1,743 / oz Yen 137/Dollar Bitcoin $21,250 (Hit $20k before $30k) Walking Wounded and MEME stocks are down PM Top 5 US Banks are down, PM Money Managers: Down Retail is down PM FLEX: Flexsteel industries: up PM Party City hold PRTY Up Coal is up Bitcoin related stocks are lower: Physical mining - lower This is the morning that people turn bearish. VIX is up 4.55% this morning. (Finviz) Pre-market: RED RED RED Why are all of the top 10 US Regional Banks lower this morning? - Recession Fears? - Housing Fears? - Interest Rates / Interest Income? - New Law / Politics? - USD - Stretch Her name was Darya Dugan. Looks like a Red Sparrow, which would be a valid military target if true. The Ukrainians are fighting back. VIX Climbing is a signal for short-term pressure against US Equities. By Jeffrey P. Cohen, Investment Advisor Representative
US Advanced Computing Infrastructure, Inc. Chicago Quantum |
Stock Market BLOGJeffrey CohenPresident and Investment Advisor Representative Archives
April 2024
|
 RSS Feed